
TC Watch / 熱帶氣旋 > Selected TC Review / 重要熱帶氣旋回顧 > 201716W (PAKHAR 帕卡) [Refresh 更新]
 201716W (PAKHAR 帕卡) - Profile 檔案 201716W (PAKHAR 帕卡) - Profile 檔案 |
(First draft issued on September 24, 2017; final version issued on November 9, 2017)
(初稿於 2017 年 9 月 24 日發出,最後版本於 2017 年 11 月 9 日上載)
Brief profile of PAKHAR | 帕卡小檔案:
| JTWC number 聯合颱風警報中心 (JTWC) 號碼 | 16W |
| International number 國際編號 | 1714 |
| Period of existence 生存時期 (JTWC) | 2017/08/24 20 HKT - 2017/08/27 20 HKT |
| Lifetime 壽命 (JTWC) | 3.00 days 日 |
| Maximum 1-minute wind (JTWC) JTWC 一分鐘平均最高中心風速 | 60 knots 節 (Severe Tropical Storm 強烈熱帶風暴) |
| Minimum pressure (JTWC) JTWC 最低氣壓 | 978 hPa 百帕 |
| Highest TC signal by HKO 香港天文台發出最高熱帶氣旋警告信號 |
8 (SE) (Gale or Storm Signal 烈風或暴風信號) |
| Closest point of approach by HKO 香港天文台所示之最接近距離 |
WSW 90 km (real-time warning 實時報告) / SW 70 km (TC report 熱帶氣旋報告)* |
| Time of closest approach by HKO 香港天文台所示之最接近時間 |
2017/08/27 09 HKT (real-time warning 實時報告) / 07 HKT (TC report 熱帶氣旋報告) |
| Lowest pressure recorded at HKO 香港天文台錄得的最低氣壓 |
996.5 hPa 百帕 (2017/08/27 06:21 HKT) |
*Revised to SW 90 km in HKO's annual tropical cyclone publication released in early 2019.
*在天文台於 2019 年初發佈的熱帶氣旋年刊中修訂為西南方 90 公里。
TC signals for Hong Kong & Track 香港曾經生效的熱帶氣旋警告和路徑圖:
Table 表:
| Signal 信號 |
Date and time 日期和時間 |
Distance from HK 與香港的距離 |
Predicted movement 預測移動趨勢 |
Max. 10-min winds 中心最高十分鐘平均風速 |
 |
2017/08/26 (SAT) 09:40 HKT | SE 750 km | NW at 30 km/h | 65 km/h (35 knots, TS) |
 |
2017/08/26 (SAT) 20:40 HKT | SE 400 km | NW at 30 km/h | 90 km/h (50 knots, STS) |
 |
2017/08/27 (SUN) 05:10 HKT | S 140 km | NW at 30 km/h | 110 km/h (60 knots, STS) |
|
2017/08/27 (SUN) 13:40 HKT | W 240 km | NW at 25 km/h | 85 km/h (45 knots, TS) |
|
2017/08/27 (SUN) 17:40 HKT | WNW 380 km | WNW at 28 km/h | 75 km/h (40 knots, TS) |
 |
2017/08/27 (SUN) 22:10 HKT | WNW 480 km | WNW at 28 km/h | 55 km/h (30 knots, TD) |
Figure 圖:
(Track figure courtesy of Lorenzo. Data from HKO. 鳴謝 Lorenzo 提供路徑圖,資料取自天文台)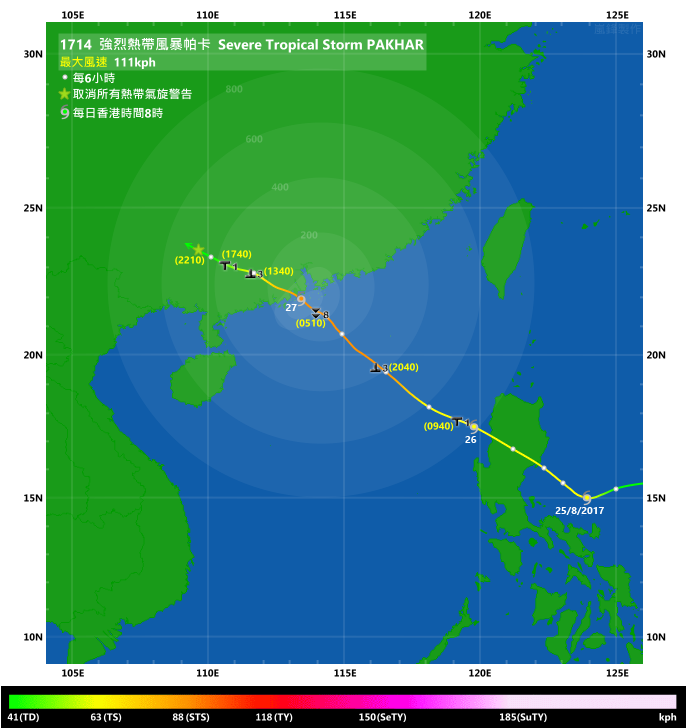
Percentile rank among storms with #8 Signal (at compilation of this review)*: *This measures the relative wind strength in Hong Kong caused by this storm compared with others that share the same signal. 指標顯示此風暴相對於其他發出同樣信號的風暴為香港帶來之風力強度 For more information, please refer to Wind Speed Data for TCs that Have Affected Hong Kong. 更多資訊載於 影響香港氣旋之風速數據 頁 |
Overall: 總計: |
|
Moderately strong 中等偏強 |
|||
| Component Ranks 分部等級 | ||||||
| Reference stations: 參考站: |
|
Moderately strong 中等偏強 |
||||
| Victoria Harbour: 維多利亞港: |
|
Moderately strong 中等偏強 |
||||
| Urban: 市區: |
|
Strong 強 |
||||
| Offshore & high ground 離岸和高地: |
|
Moderately strong 中等偏強 |
||||
Cyclones that attained similar rating (with signal #8): SAM (1999) 相近級別之熱帶氣旋 (八號信號):森姆 (1999) |
||||||
IR imagery animation 紅外線雲圖動畫:
TC track from HKWW 本站的熱帶氣旋路徑圖:
TC tracks from HKO 天文台的熱帶氣旋路徑圖:
| Past HKWW Bulletins 本站發佈 |
Please click here for bulletins on this tropical cyclone. 請按這裡。
| Storm Development Overview 風暴發展概覽 |
Unless otherwise stated, all times below are in Hong Kong Standard Time (UTC+8)
除非特別註明,下文時間均為香港標準時間 (協調世界時加 8 小時)
PAKHAR was another storm that developed within the intertropical convergence zone in late August. PAKHAR's formative convective bands gathered strength on August 24. The JTWC issued a tropical cyclone formation alert at 8 am August 24, and upgraded the system into tropical depression 16W at 8 pm the same day. A wind field analysis that night depicted a closed low-level circulation centre with strong winds near its centre. The HKO also upgraded 16W into tropical depression status later that night.
16W's spiraling characteristics improved on August 25. The JMA upgraded 16W into a tropical storm at 2 am, naming it PAKHAR. At that time, PAKHAR was moving west in the seas east of Luzon and located in the southwestern periphery of the steering subtropical ridge. The ridge was expected to dig south east of PAKHAR, allowing the storm to move northwest as it entered the South China Sea. The predictions from numerical models and official agencies suggested a landfall west of Hong Kong.
PAKHAR started to move northwest in the afternoon of August 25 and made landfall at eastern Luzon that night. It crossed the island overnight, emerging into the South China Sea early on August 26. Due to the mountainous terrain, PAKHAR had weakened somewhat but remained as a tropical storm. As the South China Sea was still very warm and the vertical wind shear reduced further, it did not take long for PAKHAR to regain strength. The HKO upgraded PAKHAR into a severe tropical storm at 8 pm, while the JMA made the upgrade at 2 am the next day.
PAKHAR moved northwest steadily in the small hours of August 27, approaching the Pearl River Estuary near 7 to 8 am. Most of PAKHAR's convections were concentrated in its northern and eastern sides prior to landfall. The NMC further upgraded PAKHAR into a typhoon that morning. PAKHAR made landfall near Taishan near 9 am, and started to move west-northwest as it reached the base of the subtropical ridge. The storm weakened rapidly on land; it first became a tropical storm at around 1 pm according to the HKO. Later that afternoon, it weakened into a tropical depression and further into an area of low pressure around midnight August 28.
帕卡是 8 月底於熱帶輻合帶形成的另一個風暴。帕卡的初始對流雲帶於 8 月 24 日發展,聯合颱風警報中心於當日上午 8 時對其發出熱帶氣旋形成警報,並於同日下午 8 時將其升格為熱帶低氣壓 16W。當晚的風場掃描顯示風暴有一閉合低層環流中心,附近有強風區。香港天文台亦於當晚稍後將 16W 升格為熱帶低氣壓。
16W 的旋捲度於 25 日轉好。日本氣象廳於上午 2 時將其升格為熱帶風暴,並命名為帕卡。當時帕卡正於呂宋以東海域西移,並處於副熱帶高壓脊西南部。預測該脊將於帕卡以東向南伸展,令風暴進入南海時向西北方向移動。數值模式及官方氣象台預報均指帕卡將於香港以西登陸。
帕卡於 25 日下午開始向西北移動,當晚登陸呂宋東部,繼而於凌晨時份橫過該島,並於 26 日早上進入南海。受呂宋高山影響,帕卡有所減弱,但仍然維持熱帶風暴強度。由於南海仍然非常溫暖,加上垂直風切變水平進一步下降,帕卡很快便重整旗鼓。香港天文台於 26 日下午 8 時將風暴升格為強烈熱帶風暴,而日本氣象廳則於翌日上午 2 時作出升格。
帕卡於 27 日凌晨穩定向西北移動,並於上午 7 至 8 時左右靠近珠江口。登陸前,帕卡大部分對流集中在其北及東面。中國中央氣象台於早上將帕卡進一步升格為颱風。帕卡於上午約 9 時於台山一帶登陸,隨後因到達副高南端而開始向西北偏西移動。帕卡於陸上快速減弱,香港天文台首先於下午 1 時將其降格為熱帶風暴。風暴於下午較後時間進一步減弱為熱帶低氣壓,並於 28 日午夜前後減弱為低壓區。
| Weather in Hong Kong During Approach 風暴影響時香港天氣狀況 |
Link to relevant HKO weather report bulletins:
26/8
27/8
香港天文台相關天氣報告連結:
26/8
27/8
As PAKHAR developed shortly after tropical cyclone HATO's impact, members of the public were still on the alert in the wake of the more powerful typhoon and were well prepared for PAKHAR's approach. Locally, there were sunny periods on August 25 and fine weather prevailed on August 26. Affected by the subsidence associated with PAKHAR, it was very hot that day with a maximum air temperature of 34.3 degrees recorded at the Observatory. The #1 Standby Signal was issued at 9:40 am when PAKHAR was around 750 km southeast of Hong Kong.
PAKHAR developed quickly during the afternoon of August 26. Due to PAKHAR's relatively fast pace, the Observatory raised the alert to the #3 Strong Wind Signal at 8:40 pm, and mentioned that higher signals may be necessary before sunrise the next day as PAKHAR would likely pass within 200 km of the territory. The handling of empty and laden cargoes was generally suspended during the afternoon of August 26.
PAKHAR's first series of outer rainbands approached Hong Kong near 10-11 pm, followed by another one near 1 am August 27. Northeasterly winds started to pick up after midnight, with winds at Waglan Island, Ngong Ping, Tate's Cairn and Tap Mun reaching gale force by 3:30 am. The Pre-No. 8 Special Announcement was issued at 3:25 am to warn the public that higher signals would be necessary by 5:30 am. As PAKHAR's central circulation approached, showers became more frequent before daybreak. Both the #8 Southeast Gale or Storm Signal and the Amber Rainstorm Warning Signal were issued at 5:10 am. At that time, PAKHAR was around 140 km south of Hong Kong (corrected to just 80 km to the south in HKO's TC report) and winds started to reach storm force at offshore areas and on high ground, whereas strong to gale force winds were generally observed over the territory. However, it turned out that winds would remain east to northeasterly for another two hours before gradually turning southeast.
Due to PAKHAR's asymmetrical shape, it was hard to locate its centre even on radar images. In Hong Kong, the strongest winds were observed between 6 am and 9 am. There were hurricane force winds at Tate's Cairn and Ngong Ping, both at substantial elevation from sea level. Quite a number of places such as Cheung Chau, Peng Chau, Tai Mei Tuk, Tap Mun and Waglan Island recorded storm force winds in the morning. It was notable that sustained winds at Cheung Chau reached 114 km/h at one point, just 4 km/h short of the hurricane force threshold. This justified the intensity estimate of 110 km/h by the HK Observatory, but it was also possible that PAKHAR reached typhoon strength briefly before landfall.
PAKHAR was the closest to Hong Kong near 9 am when it passed 90 km to the west-southwest (corrected to 7 am at a distance of 70 km to the southwest in HKO's TC report, and further revised to 90 km in HKO's annual TC publication). It made landfall at about the same time and started to take a more west-northwesterly course, thus getting further away from Hong Kong at a faster rate. As the storm weakened, winds in Hong Kong moderated sharply beyond 10 am even though southeasterly winds continued to prevail. Gales were confined to southern Hong Kong by noon as PAKHAR weakened into a tropical storm shortly after. The #3 Strong Wind Signal was issued at 1:40 pm to replace the #8 Signal when PAKHAR was 240 km away from Hong Kong. Public transport services gradually resumed in the afternoon, as winds eased to strong force levels. Meanwhile, there was persistent rainfall in the afternoon with occasional heavy showers, but they were generally weaker than those in the morning. The Amber Rainstorm Warning was cancelled at 2:10 pm.
The #3 Strong Wind Signal was replaced by the #1 Standby Signal at 5:40 pm, not long after PAKHAR moved into Guangxi province. The Signal remained in force until 10:10 pm when PAKHAR degenerated gradually into an area of low pressure. Locally, a total rainfall of 165.3 mm was recorded at the HK Observatory on August 27; most regions within the territory recorded more than 100 mm of rain with several places in the New Territories reaching 200 mm. The Landslip Warning was in force for 7 hours. Affected by an active southerly airstream, the weather remained unstable on August 28 and another 98.3 mm of rain was recorded at the Observatory. The weather improved on August 29 as the subtropical ridge re-established in southern China.
In Hong Kong, the government received more than 230 reports of fallen trees. 62 people were injured during PAKHAR's approach and sought medical assistance at the emergency units of public hospitals. Two people hiking at the Kowloon Peak were stranded for a day, before they were eventually rescued in the afternoon of August 27. More than 300 flights were cancelled or delayed. There were 16 reports of flooding but the extent of damage due to storm surge was much less widespread than that of HATO. As for Macau, PAKHAR passed at a distance of 40 km in the morning of August 27. Storm surge was insignificant and the city's effort to deal with HATO's aftermath resumed after PAKHAR's approach.
It is worth mentioning that the #8 Signal for PAKHAR was issued only 3.5 days after the cancellation of the #8 Signal for HATO, making it the quickest succession of #8 Signals since July 1966 (3 days 3.5 hours between the #8 Signals for tropical cyclones LOLA and MAMIE).
由於帕卡於熱帶氣旋天鴿襲港後不久形成,市民因先前較強的天鴿來襲時已做好準備,所以普遍對帕卡來臨的警覺性較高。本港方面,8 月 25 日部分時間有陽光,穩定天氣於 26 日維持。受帕卡的外圍下沉氣流影響,本港 26 日天氣酷熱,天文台錄得最高氣溫 34.3 度。天文台於當日上午 9 時 40 分發出一號戒備信號,當時帕卡位於香港東南約 750 公里。
帕卡於 26 日下午快速整固。由於帕卡移動速度較快,天文台於下午 8 時 40 分發出三號強風信號,並指出帕卡可能於香港 200 公里範圍內掠過,翌日日出前或有需要改發更高信號。因應風暴逼近,貨櫃碼頭的吉櫃及重櫃交收服務於 26 日下午陸續暫停。
帕卡第一波外圍雨帶於下午 10 至 11 時到達本港,27 日上午 1 時左右第二波到達。午夜過後,本港東北風開始加強;至上午 3 時 30 分,橫瀾島、昂坪、大老山及塔門已經吹烈風。天文台於上午 3 時 25 分發出預警八號熱帶氣旋警告信號之特別報告,表示將最遲於上午 5 時 30 分改發八號信號。隨著帕卡的中心環流靠近,日出前雨勢逐漸變得頻密。天文台於上午 5 時 10 分同時發出八號東南烈風或暴風信號及黃色暴雨警告信號,當時帕卡於香港以南約 140 公里 (天文台於事後熱帶氣旋報告中修訂為 80 公里),離岸及高地開始吹暴風,而廣泛地區吹強風至烈風。可是,八號信號發出後兩小時內,本港仍普遍吹東至東北風,其後風向才逐漸轉為東南。
由於帕卡形狀不對稱,即使從雷達圖上亦難以確定帕卡的中心位置。於香港,普遍地區於上午 6 至 9 時風勢最大。位處高地的大老山及昂坪均曾錄得颶風,而有數處地方如長洲、坪洲、大美督、塔門及橫瀾島則於早上錄得暴風,其中比較注目的是長洲錄得持續風速達每小時 114 公里,只差每小時 4 公里就達到颶風下限。此觀測確認天文台對風暴的每小時 110 公里風速估算,而風暴登陸前亦有可能短暫達颱風級。
帕卡於上午 9 時左右最接近香港,於西南偏西方約 90 公里處掠過 (天文台於事後熱帶氣旋報告中修訂帕卡最接近本港時間為上午 7 時,於西南方約 70 公里處掠過,繼而於熱帶氣旋年刊中修訂為 90 公里)。它於差不多同樣時間登陸,並開始向西北偏西移動,遠離香港速度加快。隨著風暴減弱,雖然本港仍然吹東南風,但風勢於上午 10 時後明顯緩和。至正午,烈風只局限於本港南部,而帕卡隨後減弱為熱帶風暴。天文台於下午 1 時 40 分改發三號強風信號,取代八號信號,當時帕卡距離香港約 240 公里。隨著風勢減弱至強風水平,公共交通服務於下午陸續回復正常。與此同時,本港降雨持續,間中有較大驟雨,但雨勢一般比上午弱;天文台於下午 2 時 10 分取消黃色暴雨警告信號。
帕卡進入廣西省後不久,天文台於下午 5 時 40 分改發一號戒備信號,取代三號信號。一號信號維持至下午 10 時 10 分,帕卡之後逐漸減弱為低壓區。天文台於 27 日共錄得 165.3 毫米雨量;香港普遍地區錄得超過 100 毫米雨量,新界部分地區更錄得超過 200 毫米。山泥傾瀉警告於 27 日下午共生效約 7 小時。受活躍偏南氣流影響,本港 28 日天氣仍然不穩定,天文台亦錄得 98.3 毫米雨量。隨著副熱帶高壓脊再度於華南建立,天氣於 29 日轉好。
風暴襲港期間,香港政府共接獲超過 230 宗塌樹報告,62 人受傷並前往公共醫院的急症室接受診治。兩人於飛鵝山行山時被困超過一日,至 27 日下午才獲救。超過 300 班航班取消或延誤,而水浸報告則有 16 宗,但風暴潮的影響遠較天鴿時輕微。澳門方面,帕卡於 27 日早上於該地 40 公里附近掠過,風暴潮影響同樣輕微;帕卡過後,澳門恢復天鴿來襲後的善後工作。
值得一提的是,帕卡的八號信號於天鴿的八號信號取消後 3.5 日後發出,成為自 1966 年 7 月以來相隔時間最短的兩次八號信號 (當年熱帶氣旋露娜及瑪媚的八號信號只相隔 3 日又 3.5 小時)。
| Image Gallery 圖片庫 |

Figure 1 - Satellite image of PAKHAR at formation
圖 1 - 帕卡形成時之衛星雲圖

Figure 2 - Wind field analysis at 9:26 pm August 24
圖 2 - 8 月 24 日下午 9 時 26 分之風場掃描圖

Figure 3 - Steering flow chart at 8 am August 26
圖 3 - 8 月 26 日上午 8 時之駛流場圖

Figure 4 - Forecast tracks from various official agencies at 8 am August 26.
圖 4 - 8 月 26 日上午 8 時各官方氣象台之預測路徑圖

Figure 5 - Satellite image of PAKHAR at 5 pm August 26. Image from weather-models.info.
圖 5 - 帕卡於 8 月 26 日下午 5 時之衛星雲圖。圖片來源:weather-models.info。

Figure 6 - NMC's track and intensity forecast at 9 am August 27. Note that the NMC upgraded PAKHAR into a typhoon before landfall.
圖 6 - 中國中央氣象台於 8 月 27 日上午 9 時的路徑及強度預測,留意該台於帕卡登陸前將其升格為颱風。

Figure 7 - Satellite image of PAKHAR near landfall at Taishan
圖 7 - 帕卡登陸台山前的衛星雲圖

Figure 8 - HKO's estimates of PAKHAR's wind radii at 8 am August 27
圖 8 - 香港天文台於 8 月 27 日上午 8 時對帕卡風圈大小的估計

Figure 9 - Calculated wind field around PAKHAR at 8 am August 27
圖 9 - 8 月 27 日上午 8 時之帕卡風場估算圖
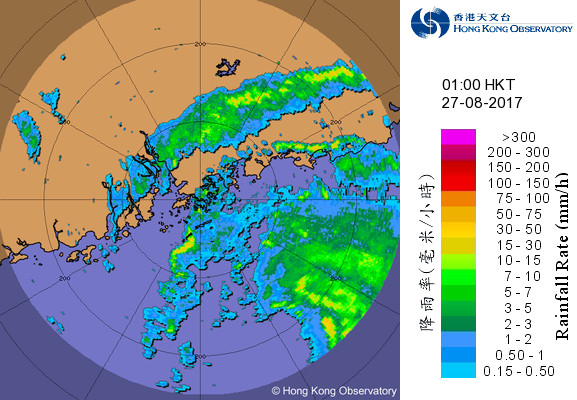


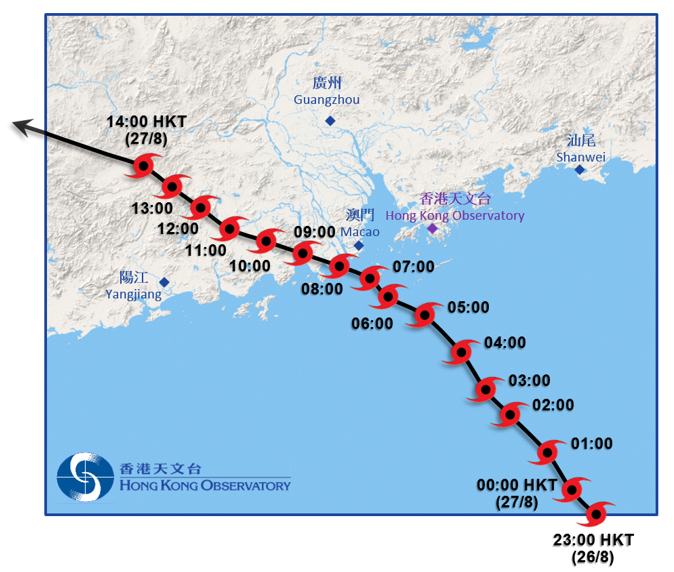
Figure 10 - Radar images at 3-hour intervals from 1 am to 10 am August 27
圖 10 - 8 月 27 日上午 1 至 10 時每三小時之雷達圖

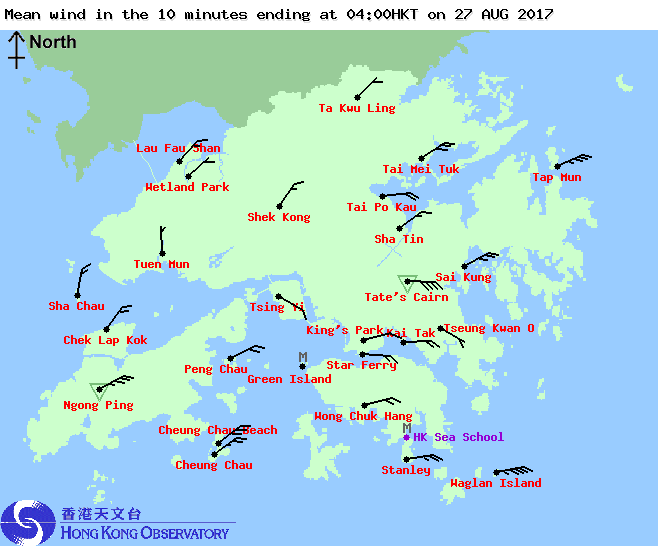

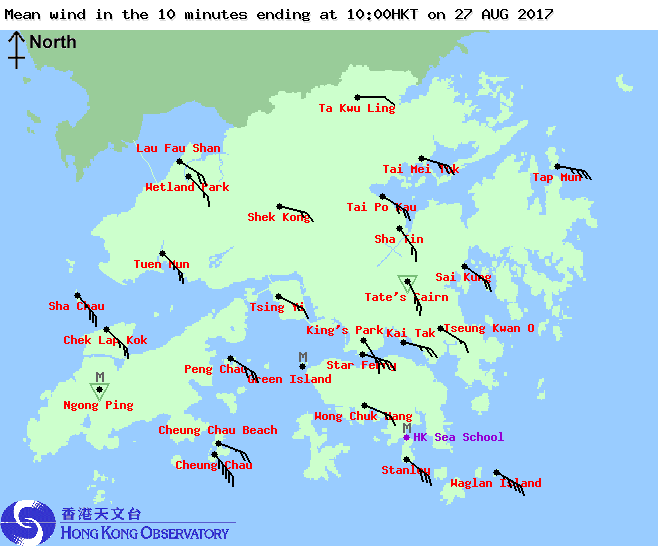
Figure 11 - Local wind disitribution maps at 3-hour intervals from 1 am to 10 pm August 27
圖 11 - 8 月 27 日上午 1 至 10 時每三小時之本港風勢分布圖


Figure 12 - Wind speed time series at Cheung Chau, Kowloon Star Ferry Pier, Tate's Cairn, Tap Mun and Waglan Island (top to bottom) on August 26-27
圖 12 - 長洲、九龍天星碼頭、大老山、塔門及橫瀾島 (上至下) 於 8 月 26 至 27 日的風速時間序列圖


Figure 13 - Sea level pressure time series at Cheung Chau and the Hong Kong Observatory (top to bottom) on August 26-27
圖 13 - 長洲及香港天文台 (上至下) 於 8 月 26 至 27 日的海平面氣壓時間序列圖

Figure 14 - Local total rainfall distribution map for August 27
圖 14 - 8 月 27 日本港總雨量分布圖

Figure 15 - Discrepancy between HKO's 5 am August 27 location fixes in its real time TC bulletin (red dot), TC warning for shipping issued 1.5 hours later (yellow dot), and its TC report issued on November 8 (pink dot, estimated from the reported distance, direction and pattern of the rainbands.)
圖 15 - 天文台對帕卡於 8 月 27 日上午 5 時定位之分歧。紅、黃、粉紅點分別為實時熱帶氣旋警報、1.5 小時後發出之為船舶提供的熱帶氣旋警告、以及 11 月 8 日發出之熱帶氣旋報告中所述位置 (後者根據所提供方向、距離及螺旋雨帶形態估計)
| Winds Recorded at Reference Stations 參考站所錄得的風速 |
| Station 風速站 |
Max. 10-min avg. wind speed 最高十分鐘平均風速 |
Beaufort classification 蒲福氏風級分類 |
| Chek Lap Kok 赤鱲角 | 76 km/h | GALE 烈風 |
| Cheung Chau 長洲 | 114 km/h | STORM 暴風 |
| Kai Tak 啟德 | 64 km/h | GALE 烈風 |
| Lau Fau Shan 流浮山 | 62 km/h | STRONG 強風 |
| Sai Kung 西貢 | 75 km/h | GALE 烈風 |
| Sha Tin 沙田 | 38 km/h | Fresh 清勁 |
| Ta Kwu Ling 打鼓嶺 | 41 km/h | STRONG 強風 |
| Tsing Yi (SHL) 青衣蜆殼油庫 | 43 km/h | STRONG 強風 |
| Number of stations recording at least STRONG force (force 6 - 7) winds: | 7 |
| Number of stations recording at least GALE force (force 8 - 9) winds: | 4 |
| Number of stations recording at least STORM force (force 10 - 11) winds: | 1 |
| Number of stations recording HURRICANE force (force 12) winds: | 0 |
| 錄得 強風 (6 - 7 級) 或更高風速的站數: | 7 |
| 錄得 烈風 (8 - 9 級) 或更高風速的站數: | 4 |
| 錄得 暴風 (10 - 11 級) 或更高風速的站數: | 1 |
| 錄得 颶風 (12 級) 風速的站數: | 0 |
| Charts and Figures 各項數據 |
Table 1: Track data from HKWW:
表一 : 香港天氣觀測站之路徑資料
YYMMDDZZ Lat Long Wind |
Table 2: Maximum gust and hourly average wind speed recorded in Hong Kong from HKO:
表二 : 香港天文台公佈的各站最高每小時平均風力和陣風數據 (英文)
| Station | Maximum Gust | Maximum Hourly Mean Wind | ||||||
|---|---|---|---|---|---|---|---|---|
| Direction | Speed (km/h) |
Date/Month | Time | Direction | Speed (km/h) |
Date/Month | Time | |
| Bluff Head (Stanley) | ENE | 117 | 27/8 | 05:33 | ESE | 68 | 27/8 | 07:00 |
| Central Pier | E | 113 | 27/8 | 05:13 | E | 63 | 27/8 | 06:00 |
| Cheung Chau | E | 155 | 27/8 | 06:18 | ESE | 101 | 27/8 | 08:00 |
| Cheung Chau Beach | ENE | 146 | 27/8 | 06:17 | E | 101 | 27/8 | 07:00 |
| Hong Kong International Airport | ESE | 101 | 27/8 | 07:59 | ESE | 68 | 27/8 | 08:00 |
| Kai Tak | E | 121 | 27/8 | 07:31 | E | 52 | 27/8 | 07:00 |
| King's Park | ESE | 108 | 27/8 | 06:54 | ESE | 47 | 27/8 | 07:00 |
| Lau Fau Shan | ENE | 99 | 27/8 | 06:52 | ENE | 54 | 27/8 | 07:00 |
| Ngong Ping | ESE | 173 | 27/8 | 08:14 | E | 118 | 27/8 | 08:00 |
| North Point | ENE | 128 | 27/8 | 06:14 | ENE | 72 | 27/8 | 06:00 |
| Peng Chau | E | 122 | 27/8 | 06:26 | E | 79 | 27/8 | 07:00 |
| Ping Chau | E | 75 | 27/8 | 05:40 | E | 22 | 27/8 | 05:00 |
| Sai Kung | NE | 128 | 27/8 | 05:44 | ENE | 67 | 27/8 | 06:00 |
| Sha Chau | ESE | 110 | 27/8 | 07:49 | SE | 77 | 27/8 | 09:00 |
| Sha Lo Wan | SE | 117 | 27/8 | 09:26 | E | 58 | 27/8 | 08:00 |
| Sha Tin | N | 112 | 27/8 | 05:46 | NE | 31 | 27/8 | 07:00 |
| Shek Kong | ENE | 101 | 27/8 | 07:12 | NE | 41 | 27/8 | 06:00 |
| Star Ferry (Kowloon) | E | 112 | 27/8 | 06:34 | E | 58 | 27/8 | 07:00 |
| Ta Kwu Ling | E | 88 | 27/8 | 08:08 | NE | 34 | 27/8 | 07:00 |
| Tai Mei Tuk | ENE | 146 | 27/8 | 06:06 | ENE | 103 | 27/8 | 07:00 |
| Tai Mo Shan | SE | 182 | 27/8 | 09:00 | SE | 121 | 27/8 | 10:00 |
| Tai Po Kau | E | 110 | 27/8 | 06:10 | E | 68 | 27/8 | 07:00 |
| Tap Mun* | ENE | 149 | 27/8 | 07:12 | E | 101 | 27/8 | 08:00 |
| Tate's Cairn | E | 169 | 27/8 | 06:19 | ESE | 108 | 27/8 | 07:00 |
| Tseung Kwan O | ESE | 90 | 27/8 | 08:29 | ESE | 27 | 27/8 | 09:00 |
| Tsing Yi Shell Oil Depot | E | 92 | 27/8 | 07:28 | ESE | 31 | 27/8 | 07:00 |
| Tuen Mun Government Offices | SE | 110 | 27/8 | 07:57 | SE | 40 | 27/8 | 09:00 |
| Waglan Island | E | 144 | 27/8 | 05:49 | E | 108 | 27/8 | 06:00 |
| Wetland Park | ENE | 81 | 27/8 | 06:27 | ENE | 31 | 27/8 | 07:00 |
| Wong Chuk Hang | ESE | 110 | 27/8 | 06:24 | E | 40 | 27/8 | 07:00 |
*The old wind station on the rooftop of Tap Mun Police Post is replaced by the new Tap Mun station on July 6, 2017.
*新塔門測風站在 2017 年 7 月 6 日取代在塔門警崗屋頂的舊測風站。
Table 3: Rainfall (in millimetres) contributed by PAKHAR from HKO (figures in brackets are based on incomplete hourly data):
表三 : 香港天文台公佈的各站雨量資料 (英文) (方括號內之數據由不完整之每小時資料擷取)
| Station | 26-Aug | 27-Aug | 28-Aug | Total Rainfall (mm) |
|
|---|---|---|---|---|---|
| Hong Kong Observatory | 6.3 |
165.3 |
98.3 |
269.9 |
|
| Hong Kong International Airport (HKA) | 2.5 |
136.2 |
25.7 |
164.4 |
|
| Cheung Chau (CCH) | 2.5 |
73.0 |
24.5 |
100.0 |
|
| H23 | Aberdeen | 2.0 |
121.0 |
90.0 |
213.0 |
| N05 | Fanling | 13.5 |
143.0 |
92.5 |
249.0 |
| N13 | High Island | 3.5 |
143.5 |
120.5 |
267.5 |
| K04 | Jordan Valley | 6.5 |
184.0 |
80.0 |
270.5 |
| N06 | Kwai Chung | 4.0 |
170.5 |
100.0 |
274.5 |
| H12 | Mid Levels | 3.0 |
171.5 |
89.0 |
263.5 |
| N09 | Sha Tin | 6.5 |
198.5 |
76.5 |
281.5 |
| H19 | Shau Kei Wan | 0.5 |
176.0 |
89.5 |
266.0 |
| SEK | Shek Kong | 8.0 |
188.0 |
[39.5] |
[235.5] |
| K06 | So Uk Estate | 4.5 |
207.5 |
113.5 |
325.5 |
| R31 | Tai Mei Tuk | 16.5 |
183.5 |
[58.5] |
[258.5] |
| R21 | Tap Shek Kok | 1.5 |
110.0 |
[36.5] |
[148.0] |
| TMR | Tuen Mun Reservoir | 4.4 |
132.0 |
31.0 |
167.4 |
| N17 | Tung Chung | 2.0 |
176.0 |
37.0 |
215.0 |
Last Accessed 最近訪問日期: Fri Apr 19 2024 09:43:48 HKT
Last Modified 最近修訂日期: Mon Jul 24 2023
