
TC Watch / 熱帶氣旋 > Selected TC Review / 重要熱帶氣旋回顧 > 201826W (MANGKHUT 山竹) [Refresh 更新]
 201826W (MANGKHUT 山竹) - Profile 檔案 201826W (MANGKHUT 山竹) - Profile 檔案 |
(First draft issued on September 25, 2018; final version issued on January 10, 2019)
(初稿於 2018 年 9 月 25 日發出,最後版本於 2019 年 1 月 10 日上載)
Brief profile of MANGKHUT | 山竹小檔案:
| JTWC number 聯合颱風警報中心 (JTWC) 號碼 | 26W |
| International number 國際編號 | 1822 |
| Period of existence 生存時期 (JTWC) | 2018/09/07 14 HKT - 2018/09/17 08 HKT |
| Lifetime 壽命 (JTWC) | 9.75 days 日 |
| Maximum 1-minute wind (JTWC) JTWC 一分鐘平均最高中心風速 | 155 knots 節 (Category 5 Super Typhoon 五級超級颱風) |
| Minimum pressure (JTWC) JTWC 最低氣壓 | 898 hPa 百帕 |
| Highest TC signal by HKO 香港天文台發出最高熱帶氣旋警告信號 |
10 (Hurricane Signal 颶風信號) |
| Closest point of approach by HKO 香港天文台所示之最接近距離 |
SSW 100 km (real-time warning 實時報告 / TC report 熱帶氣旋報告) |
| Time of closest approach by HKO 香港天文台所示之最接近時間 |
2018/09/16 14 HKT (real-time warning 實時報告) / 13 HKT (TC report 熱帶氣旋報告) |
| Lowest pressure recorded at HKO 香港天文台錄得的最低氣壓 |
977.0 hPa 百帕 (2018/09/16 13:28 HKT) |
TC signals in Hong Kong 香港曾經生效的熱帶氣旋警告:
| Signal 信號 |
Date and time 日期和時間 |
Distance from HK 與香港的距離 |
Predicted movement 預測移動趨勢 |
Max. 10-min winds 中心最高十分鐘平均風速 |
 |
2018/09/14 (FRI) 22:20 HKT | ESE 1110 km | NW/WNW at 28 km/h | 240 km/h (130 knots, SuT) |
 |
2018/09/15 (SAT) 16:20 HKT | SE 660 km | WNW at 30 km/h | 195 km/h (105 knots, SuT) |
 |
2018/09/16 (SUN) 01:10 HKT | SE 410 km | WNW at 30 km/h | 195 km/h (105 knots, SuT) |
 |
2018/09/16 (SUN) 07:40 HKT | SSE 220 km | WNW at 30 km/h | 175 km/h (95 knots, ST) |
 |
2018/09/16 (SUN) 09:40 HKT | SSE 150 km | WNW at 30 km/h | 175 km/h (95 knots, ST) |
 |
2018/09/16 (SUN) 19:40 HKT | W 240 km | WNW at 30 km/h | 155 km/h (85 knots, ST) |
|
2018/09/17 (MON) 05:20 HKT | W 500 km | WNW at 25 km/h | 110 km/h (60 knots, STS) |
|
2018/09/17 (MON) 14:40 HKT | WNW 720 km | WNW at 20 km/h | 55 km/h (30 knots, TD) |
 |
2018/09/17 (MON) 19:10 HKT | WNW 790 km | NW at 20 km/h | 45 km/h (25 knots, TD) |
Percentile rank among all storms necessitating at least the #3 Strong Wind Signal from 1986 to 2018 (at compilation of this review)*: *This measures the relative wind strength in Hong Kong caused by this storm compared with others. 指標顯示此風暴相對於其他氣旋為香港帶來之風力強度 For more information, please refer to Wind Speed Data for TCs that Have Affected Hong Kong. 更多資訊載於 影響香港氣旋之風速數據 頁 |
Overall: 總計: |
|
Strongest 最強 |
|||
| Component Ranks 分部等級 | ||||||
| Reference stations: 參考站: |
|
Strongest 最強 |
||||
| Victoria Harbour: 維多利亞港: |
|
Strongest 最強 |
||||
| Urban: 市區: |
|
Strongest 最強 |
||||
| Offshore & high ground 離岸和高地: |
|
Strongest 最強 |
||||
Cyclones that attained similar rating: (Winds observed during MANGKHUT's approach were the strongest since 1986.) 相近級別之熱帶氣旋:(山竹吹襲期間的風勢是自 1986 年來最為猛烈) |
||||||
IR imagery animation 紅外線雲圖動畫:
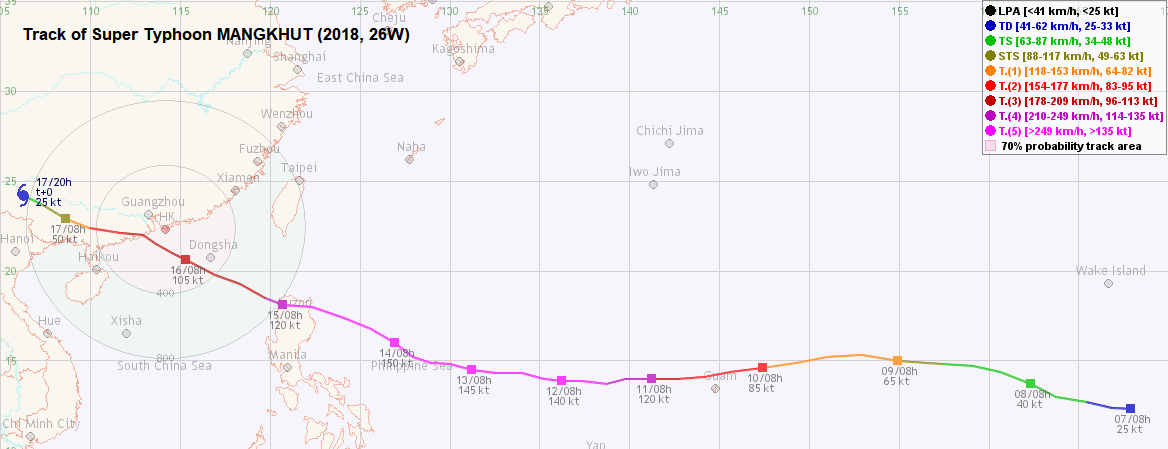
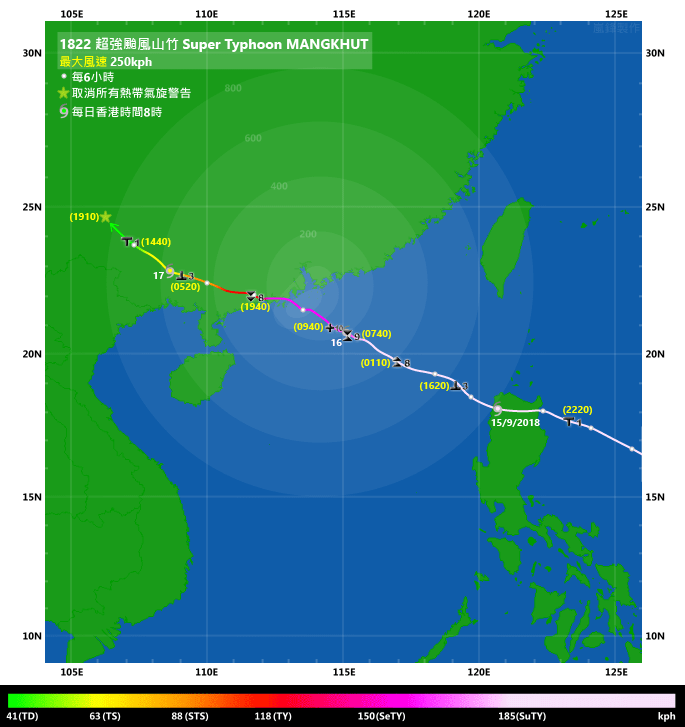
TC track from HKWW 本站的熱帶氣旋路徑圖:

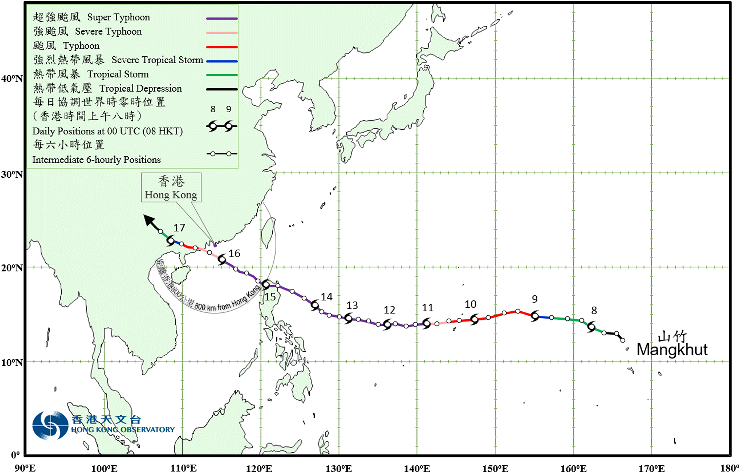
TC track from HKO 天文台的熱帶氣旋路徑圖:
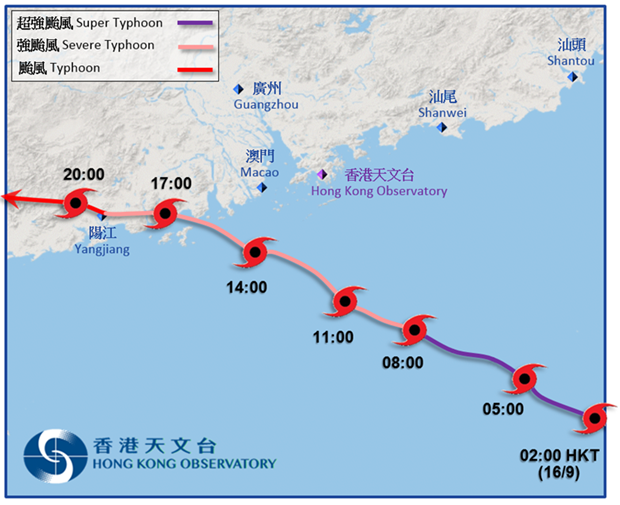
TC track with signal information 附有熱帶氣旋警告信號資料的路徑圖:
(Track figure courtesy of Lorenzo. Data from HKO. 鳴謝 Lorenzo 提供路徑圖,資料取自天文台)
| Past HKWW Bulletins 本站發佈 |
Please click here for bulletins on this tropical cyclone. 請按這裡。
| Storm Development Overview 風暴發展概覽 |
Unless otherwise stated, all times below are in Hong Kong Standard Time (UTC+8)
除非特別註明,下文時間均為香港標準時間 (協調世界時加 8 小時)
MANGKHUT is one of the few tropical cyclones that made it all the way from east of 165°E to the South China Sea.
MANGKHUT's formative cloud bands developed near the International Date Line and moved west quickly in early September. The patch of convections gained strength on September 7 and the JTWC issued a tropical cyclone formation alert, which was quickly upgraded into tropical cyclone bulletin status with the system given the storm number 26W in the morning, when the cyclone was still below tropical depression strength (25 knots, 46 km/h). Meanwhile, the JMA upgraded 26W into a tropical storm that night and named it MANGKHUT.
At the time of MANGKHUT's formation, a broad subtropical ridge was situated in the northwest Pacific north of the storm. Numerical models predicted a generally westward motion in the next couple of days, with the possibility of a southward dip in response to a strengthening ridge. A turn to the west-northwest was expected later on as an extension of the ridge would develop east of MANGKHUT. Situated in warm seas with low vertical wind shear, MANGKHUT developed steadily over the next few days, intensifying into a severe tropical storm early on September 9. Both the JMA and JTWC upgraded MANGKHUT into a typhoon that morning as the storm attempted to develop a central dense overcast with tight circulation around the centre.
MANGKHUT turned from west-northwest to due west later on September 9. It started to move west-southwest on September 10 at a rather high speed (around 30 km/h). MANGKHUT passed just north of Guam in the late afternoon, with an estimated intensity of 90-100 knots (167-185 km/h) by the JTWC. The island experienced strong winds and high waves, and the storm left most of the island without power; even the NOAA's radar at Guam was interrupted because of the power outage.
Shortly after skirting Guam, MANGKHUT underwent rapid intensification on September 11. MANGKHUT's central dense overcast expanded in size and its eye turned clear during the day. The JTWC's assessment of MANGKHUT's intensity (1-minute average) was adjusted upwards from 100 knots (185 km/h) at 8 pm September 10 to 140 knots (259 km/h) a day later, while JMA's assessment (10-minute average) was increased from 85 knots (157 km/h) to 105 knots (194 km/h). In response to the continued westward motion, numerical models and official agencies gradually shifted their forecast track westwards.
MANGKHUT intensified further after attaining category 5 strength. According to the JTWC, MANGKHUT's intensity reached its peak early on September 13, with an estimated wind speed of 155 knots (287 km/h). It later underwent an eyewall replacement cycle, but remained as a category 5 super typhoon. During the night of September 13, the subtropical ridge could be seen strengthening east of the storm. This provided the northward track component expected for long by the numerical models, and MANGKHUT started to move west-northwest. The storm moved almost due northwest in the small hours of September 14, before turning to west-northwest during the day. It also crossed a pool of very warm waters and its eyewall cloud-top temperatures dropped again. The JTWC kept MANGKHUT's estimated intensity at 145 knots (269 km/h) just before landfall. Meanwhile, the HKO adjusted its assessment from 240 km/h to 250 km/h, the peak during MANGKHUT's period of existence.
MANGKHUT made landfall in the northern Philippine province of Cagayan near 2 am September 15. Its eye shrank and later disappeared as it passed through the mountainous terrain. The storm moved west on land and managed to enter the South China Sea near 9 am, seven hours after landfall. Convections near its centre were visibly thinner, but the storm maintained a large circulation in the South China Sea. The HKO kept MANGKHUT as a 195-km/h super typhoon as it emerged into the Sea, but other agencies were not as optimistic on its intensity.
MANGKHUT resumed its west-northwestward motion in northern South China Sea. It skirted the seas off Dongsha in the small hours of September 16 and accelerated towards western Guangdong that day. The HKO downgraded MANGKHUT into a 175-km/h severe typhoon in the morning, while other agencies adopting the 10-minute wind speed standard generally kept their estimated intensities near 75 knots (139 km/h). MANGKHUT made its final landfall in Taishan, Guangdong near 5 pm; the NMC of China estimated that the storm was carrying winds of up to 45 m/s (162 km/h). MANGKHUT turned west soon after landfall. It weakened gradually on land and lost its spiraling characteristics on September 17. Both the HKO and NMC of China ceased issuing warning bulletins on the system in the night of September 17.
山竹是少數於東經 165 度以東形成而最終能進入南海的熱帶氣旋。
9 月初,山竹的初始雲帶於國際換日線一帶發展。該雲團於 7 日有進一步發展跡象,聯合颱風警報中心對其發出熱帶氣旋形成警報,不久後更發出熱帶氣旋路徑圖並給予風暴編號 26W,但值得留意的是當時 26W 並未達熱帶低氣壓強度 (25 節、每小時 46 公里)。另一邊廂,日本氣象廳當晚升格 26W 為熱帶風暴,並將其命名為山竹。
山竹形成初時,一道廣闊副熱帶高壓脊處於風暴北面,正覆蓋西北太平洋。數值模式大致預測山竹未來數天西移,路徑有機會隨副高增強而稍為南偏。其後,預料副高會於山竹以東發展,屆時它將轉西北偏西移動。由於山竹所在之處海水溫暖且垂直風切變微弱,山竹於其後數天穩步增強,於 9 日早段增強為強烈熱帶風暴。隨著風暴發展出中心密集雲區且周邊對流緊密,日本氣象廳及聯合颱風警報中心均於當日早上將 26W 升格為颱風。
山竹於 9 日後段轉為西移,結束其先前向西北偏西移動的趨勢。它於 10 日以較高速度 (每小時約 30 公里) 向西南偏西移動,下午較後時間掠過關島對開海域,當時聯合颱風警報中心的估計強度為 90 至 100 節 (每小時 167 至 185 公里)。關島受強風及大浪侵襲,風暴過後大多數地區失去電力供應,就連美國國家海洋及大氣管理局於關島的雷達亦暫停運作。
掠過關島後不久,山竹於 11 日出現爆發性增強。山竹的中心密集雲區向外擴展,風眼於日間漸變清晰。聯合颱風警報中心的估計風速 (一分鐘平均) 由 10 日下午 8 時的 100 節 (每小時 185 公里) 上調至一日後的 140 節 (每小時 259 公里),而日本氣象廳的估計 (十分鐘平均) 則由 85 節 (每小時 157 公里) 上調至 105 節 (每小時 194 公里)。與此同時,由於山竹繼續西移,數值模式及官方氣象台均逐漸將其預測路徑西調。
成為五級超級颱風後,山竹進一步增強。聯合颱風警報中心估計山竹於 13 日早段達到其巔峰強度,最高風速為 155 節 (每小時 287 公里)。風暴其後進入眼牆置換週期,但仍然維持五級超級颱風強度。13 日晚,副熱帶高壓脊開始於山竹以東建立,令預報模式一直預計的路徑向北分量實現。山竹於 14 日凌晨曾向西北移動,日間轉為向西北偏西移。它稍後經過非常溫暖的海域,其眼牆雲頂溫度再度下降。聯合颱風警報中心維持其 145 節 (每小時 269 公里) 的強度估算,而香港天文台則將其強度由每小時 240 公里上調至 250 公里,為山竹整段生存時期中的最高強度。
山竹於 15 日上午約 2 時登陸菲律賓北部的卡加延省。登陸後山竹橫過呂宋的高山,其風眼先收窄、後消失。風暴於陸上向西移動,隨後於上午約 9 時、登陸後約 7 小時進入南海。山竹中心附近的對流明顯轉薄,但風暴於南海維持較大的環流。香港天文台於山竹進入南海後維持其超強颱風的強度估計 (每小時 195 公里),但其他機構對其強度估算普遍較低。
山竹於南海回復向西北偏西移動,於 16 日凌晨掠過東沙對開海域,日間加速靠近廣東西部沿岸。香港天文台當早將山竹降格為每小時 175 公里風速的強颱風,而其他採用十分鐘平均風速的機構對其強度估算約為 75 節 (每小時 139 公里)。山竹於 16 日下午約 5 時登陸廣東台山一帶,中國中央氣象台估計其中心附近風速為每秒 45 米 (每小時 162 公里)。山竹登陸後隨即轉向偏西移動。它於陸上逐漸減弱,於 17 日其螺旋形態逐步消失。香港天文台及中國中央氣象台於當晚停止對其作出發佈。
| Weather in Hong Kong During Approach 風暴影響時香港天氣狀況 |
Link to relevant HKO weather report bulletins:
14/9 ●
15/9 ●
16/9 ●
17/9
香港天文台相關天氣報告連結:14/9 ●
15/9 ●
16/9 ●
17/9
MANGKHUT received widespread attention in Hong Kong during its long trip across the northwest Pacific due to its strength and the possibility of affecting the territory as a violent super typhoon. It turned out to inflict the most severe damage to the territory since Typhoon ELLEN in 1983.
The HKO posted the first track forecast for MANGKHUT in the night of September 10. MANGKHUT was located at 144°E at that time; this was the first instance where a track forecast was issued by the HKO before a tropical cyclone crosses 140°E. In the 9-day weather forecast issued by the HKO on September 10, force 8 winds were predicted on September 16 and 17, indicating the possibility of issuing the #8 Gale or Storm Signal at that time. Consequently, airline companies such as Cathay Pacific announced on September 11 that rescheduling fees were to be waived for flights departing on these two days.
As MANGKHUT edged closer to the Philippines, the HKO indicated that they would consider issuing the #1 Standby Signal later on September 14. That day, the government held a joint press conference to warn the public of the impending danger and then implemented evacuation plans at low-lying areas such as Tai O and Lei Yue Mun. Residents were sent to temporary shelters on September 15, the day before MANGKHUT's approach.
The HKO issued the #1 Standby Signal at 10:20 pm September 14 when MANGKHUT was 1110 km from Hong Kong, still in the Philippine Sea. This broke the previous record of the greatest distance from Hong Kong at the time of signal issuance held by Typhoon Carla in 1967 (930 km). Due to MANGKHUT's large circulation, the HKO indicated that the #3 Strong Wind Signal would be issued in the afternoon of September 15, and later refined the time of issuance to between 3 and 6 pm. The signal was eventually issued at 4:20 pm, when MANGKHUT was situated at around 660 km southeast of Hong Kong. Affected by MANGKHUT's subsidence as it entered the South China Sea, the weather was very hot and generally fine on September 15. The mercury reached 35 degrees in most of the territory that afternoon; the maximum temperature of 35.1 degrees at the HKO was the second highest ever recorded there in the month of September. It was also hazy and the air quality health index reached 10+ at various locations.
Citizens were urged to complete precautionary measures by September 15. The handling of empty and laden cargoes was suspended in the night of September 14 and in the morning of September 15, respectively. Local ferry services were gradually suspended after sunset on September 15. Some vendors faced a shortage of some daily necessities such as bottled water and even duct tapes as people flocked to stock up on these items. The HKO issued the Pre-No. 8 Special Announcement at 11:10 pm, indicating that the signal change would take place within the next two hours. This buffer was fully utilized and the #8 Northeast Gale or Storm Signal was issued at 1:10 am September 16. MANGKHUT was still some 410 km from Hong Kong at that time. However, the HKO estimated that MANGKHUT's gale radius was 225 NM (417 km), and its outer rainbands had just reached the territory. Residents at low-lying areas were also warned of the rise in sea level expected during MANGKHUT's approach, with a maximum height in excess of 3.5 m above chart datum at the Victoria Harbour and 4 m above chart datum at Tai O.
Several rainbands swept across the territory within the next couple of hours and winds strengthened appreciably, reaching storm force at Tate's Cairn and gale force at Cheung Chau, Green Island, Sha Chau and Waglan Island by 4 to 5 am. At 6 am, the HKO indicated that MANGKHUT was expected to come closest to Hong Kong near midday at a distance of 100 km, and that higher signals would be considered in the next few hours. MANGKHUT's more intense rainbands within its circulation reached Hong Kong near 7 am; predicting a surge in wind speed, the HKO issued the #9 Increasing Gale or Storm Signal at 7:40 am. At the same time, MANGKHUT was downgraded into a severe typhoon.
By 9 am, Waglan Island and Tate's Cairn were the first locations to register hurricane force winds. Locations exposed to the northeast saw an abrupt increase in their wind speeds after 9 am. This and the sustained hurricane force winds reaching 130-140 km/h at Waglan Island prompted the HKO to issue the #10 Hurricane Signal at 9:40 am, when MANGKHUT was 150 km south-southeast of Hong Kong. For the first time in more than 50 years, the #10 Signal was issued in consecutive years. The incessant squally heavy showers also necessitated the Amber Rainstorm Warning at 9:10 am, which was upgraded to the Red Rainstorm Warning at 10:55 am and was followed by the Special Announcement on Flooding in the northern New Territories at 11:25 am, and the Landslip Warning at 2:20 pm.
Violent winds associated with an intense rainband in MANGKHUT's northern semicircle swept across Hong Kong from east to west near 10 am. Waglan Island was the first station to feel its fury, when its sustained wind speed surged to 180 km/h near 10:20 am, gusting to 212 km/h (later revised to 220 km/h). Tate's Cairn registered sustained winds of 189 km/h and maximum gusts of 256 km/h shortly after. Cheung Chau Beach, Green Island and Tai Mei Tuk also recorded hurricane force winds near 11 am. The HKO revised their estimate of MANGKHUT's hurricane force wind radius from 60 NM (111 km) to 90 NM (167 km), to reflect the fact that Hong Kong was within the hurricane radius.
MANGKHUT reached the south of Hong Kong near noon and the wind direction started to turn east. The storm made its closest approach to Hong Kong between 1 and 2 pm, when it passed at a distance of around 100 km to the south-southwest. Hong Kong was constantly exposed to MANGKHUT's fierce circulation and winds remained violent at this point. As winds turned east to southeast, previously sheltered locations such as Cheung Chau, Kai Tak, King's Park, Lau Fau Shan, Stanley and Star Ferry became exposed and winds strengthened substantially in the afternoon. Cheung Chau recorded maximum sustained winds of 165 km/h (later revised to 173 km/h) and gusts of 213 km/h (later revised to 212 km/h) near 2 pm. Sustained hurricane force winds were also observed at Sai Kung (118 km/h), one of the 8 reference stations, while winds at Chek Lap Kok, another reference station, were just short of hurricane force. The observations in Hong Kong are concrete evidence that some agencies such as the JMA and CWB underestimated MANGKHUT's intensity. In HKO's tropical cyclone report, it was mentioned that North Point, a station within the Victoria Harbour, registered sustained hurricane force winds of 124 km/h during MANGKHUT's approach. This was the first time sustained hurricane force winds were observed there since its operation in 1998.
Apart from the violent winds, MANGKHUT's approach also drew in sea water and resulted in severe storm surge even though the cyclone did not come at the time of a high tide. The water level at Quarry Bay, Tai Po Kau and Tai O reached 3.88, 4.71 and 3.85 m, respectively, during that afternoon. The storm surge (water level minus predicted tide level) was calculated as 2.35, 3.40 and 2.42 m, respectively. The HKO confirmed that the storm surge at Quarry Bay and Tai Po Kau was the highest ever recorded, thus breaking the records set during the approaches of Typhoons WANDA and HOPE.
MANGKHUT continued to travel west-northwest in the afternoon and made landfall near Taishan at around 5 pm. As MANGKHUT receded, local winds moderated after 3 pm and even winds at Cheung Chau and Waglan Island weakened to storm force level before 5 pm. Still, the HKO insisted that the #10 Signal would remain in force for another few hours and later indicated that it would be changed to the #8 Signal between 7 and 10 pm. Rains had also diminished and the Red Rainstorm Warning was replaced by the Amber Rainstorm Warning at 6:50 pm. Finally, being confident that hurricane force winds ceased to be observed in Hong Kong, the #8 Southeast Gale or Storm Signal was issued at 7:40 pm, when MANGKHUT was 240 km west of the territory. The #10 Signal was thus in force for 10 hours, the second longest after Typhoon York on the same date in 1999 (11 hours). By the time of the signal change, storm force winds were observed in Cheung Chau, Sha Chau and Waglan Island, while gale force winds were observed in Chek Lap Kok, Kai Tak, Sai Kung, Stanley and Tate's Cairn.
As MANGKHUT's outer rainbands affected Hong Kong throughout the night, winds remained rather strong before midnight September 17. The Amber Rainstorm Warning and the Special Announcement on Flooding in the northern New Territories were cancelled at 10:30 and 11:30 pm, respectively. As winds moderated further, the HKO issued the #3 Strong Wind Signal at 5:20 am September 17. Occasional gales were still observed at Cheung Chau near daybreak. The weather improved gradually during the day and the HKO issued the #1 Standby Signal at 2:40 pm, when MANGKHUT was around 720 km from Hong Kong. The Signal was eventually cancelled at 7:10 pm; MANGKHUT was almost leaving the 800-km radius from Hong Kong at that time.
MANGKHUT's persistent violent winds and the associated severe storm surge was something not seen in Hong Kong for at least 35 years. The resulting damage was extensive; some of the major ones are listed below:
- Flooding resulting from the storm surge was more widespread than that during HATO's approach last year. The underground parking lot at Heng Fa Chuen was again flooded and most of the facilities at ground level near the coast were submerged. Although water gates were installed at Tai O, flood water was able to overflow into residences and shops. The Shing Mun River in Shatin was also flooded, and so were parts of Tseung Kwan O.
- Glass panels on many buildings were broken as a result of the strong winds and flying debris. The Harbourfront office buildings in Hung Hom were hit hard with numerous panels missing after the storm.
- Huge waves battered shorelines at east-facing locations such as Tseung Kwan O, Sai Kung and Shek O, resulting in severe damage to the levees. Numerous boats were stranded and a large amount of litter could be seen floating on the sea afterwards.
- The water and electricity supply was interrupted in some places; more than 10,000 households were out of power at one point.
- The sewage treatment facility in Sai Kung suffered damage, with several months of repair works expected before it could resume normal operations.
Over 400 people were injured and sought medical assistance at the emergency units at public hospitals during MANGKHUT's approach. 889 flights were cancelled at the airport on September 16. Almost 15,000 cases of fallen trees were reported initially*; this figure is more than 20 times of that during HATO's approach. Classes at schools (secondary or below) were suspended on September 17 and 18 due to the hazardous road conditions resulting from the fallen trees, and most universities had their classes suspended on September 17 as well. However, most workers still needed to get back to work on September 17 when most bus routes were unavailable due to road blockages, and when the services at parts of the East Rail Line and the Light Rail had not yet resumed. This resulted in a chaotic situation where some were left stranded for several hours at the railway station. Although the government was generally praised for its preparations before MANGKHUT's approach, it received considerable criticism for its failure to anticipate the traffic conditions.
Meanwhile, winds were relatively weaker in Macau even though it was closer to MANGKHUT's centre than Hong Kong was. This is because Macau was spared from MANGKHUT's most intense rainbands. Flooding in low-lying areas was almost as serious as during HATO's approach last year. Casinos were closed, apparently for the first time ever in history, due to the typhoon. Fortunately, no lives were lost thanks to the lesson learned last year and the early preparations made.
*This figure was later updated to more than 60,000.
由於山竹強度高並有機會以超級颱風強度影響香港,山竹展開其橫過西北太平洋的漫長旅程時已獲廣泛關注。結果山竹正面吹襲香港,並造成自 1983 年颱風愛倫吹襲以來最嚴重及廣泛的破壞。
香港天文台於 9 月 10 日晚首次發佈山竹的預測路徑圖,當時山竹仍遠在東經 144 度,是天文台首次於熱帶氣旋未進入東經 140 度範圍便已發出路徑圖。天文台早於 10 日的九天天氣預報中提及 16 及 17 日將吹 8 級烈風,即屆時有機會發出八號烈風或暴風信號。有鑑於此,部分航空公司如國泰宣佈此兩天出發的航班可獲免費改期。
隨著山竹靠近菲律賓,天文台表示會於 14 日晚考慮發出一號戒備信號。當天下午,政府舉行跨部門記者會,提醒市民山竹來襲,並於低窪地區如大澳及鯉魚門採取疏散措施,市民於 15 日、山竹來臨前一日被安排於臨時庇護中心暫住。
天文台於 14 日下午 10 時 20 分發出一號戒備信號,當時山竹仍距離香港 1110 公里,位處菲律賓以東海域。這打破天文台發出熱帶氣旋警告信號時氣旋與香港的距離,先前的紀錄保持者為 1967 年的颱風嘉娜 (930 公里)。由於山竹環流大,天文台表示會於 15 日下午改發三號強風信號,其後將時間範圍縮窄至下午 3 至 6 時間。最終該信號於下午 4 時 20 分發出,山竹仍於香港東南約 660 公里。山竹進入南海後,本港受其外圍下沉氣流影響,15 日大致天晴而天氣酷熱,大多數地區氣溫達 35 度,而天文台當日高溫 35.1 度亦是有紀錄以來九月份第二高。由於有煙霞,本港空氣質素欠佳,多區錄得空氣質量健康指數達 10+ 水平。
天文台呼籲市民於 15 日完成所有防風措施。貨櫃碼頭的吉櫃及重櫃交收服務分別於 14 日晚間及 15 日早上暫停,而港內渡輪服務普遍於 15 日日落後開始暫停。由於市民搶購水甚或膠紙等日用品,部分商鋪供應短缺。天文台於 15 日下午 11 時 10 分發出預警八號熱帶氣旋警告信號之特別報告,表示將於兩小時內改發信號。結果天文台用盡兩小時預警,於 16 日上午 1 時 10 分改發八號東北烈風或暴風信號。當時山竹距離香港約 410 公里,其估計烈風圈半徑為 225 海里 (417 公里),而山竹的外圍雨帶已開始影響本港。天文台亦警告低窪地區居民將出現水浸,維港海水高度會達海圖基準面以上 3.5 米,大澳更達海圖基準面以上 4 米。
隨後數小時,多道雨帶掠過香港,而風勢拾級而上,至上午 4 至 5 時大老山吹暴風,而長洲、青洲、沙洲及橫瀾島吹烈風。上午 6 時,天文台表示山竹將於正午前後最接近香港,並於香港約 100 公里外掠過,亦將於未來數小時考慮改發更高信號。山竹環流內另一道較強烈的雨帶於上午 7 時左右抵港。由於預期風速會進一步上揚,天文台於上午 7 時 40 分改發九號烈風或暴風風力增強信號,同時將山竹降格為強颱風。
橫瀾島及大老山率先於上午 9 時前開始吹颶風,而東北面當風的地區於 9 時過後風速明顯上升。隨著橫瀾島錄得持續風速達每小時 130 至 140 公里,天文台於上午 9 時 40 分改發十號颶風信號,山竹當時距港約 150 公里,而這亦是 50 多年來首次連續兩年均需發出此信號。同時,由於狂風大驟雨不停,黃色暴雨警告信號於上午 9 時 10 分發出,其後於上午 10 時 55 分轉為紅色。新界北部水浸特別報告及山泥傾瀉警告亦分別於上午 11 時 25 分及下午 2 時 20 分發出。
山竹北半圓的一道強雨帶與其相關的狂風於上午 10 時左右自東向西掃過本港,橫瀾島首當其衝,持續風速上升至約 10 時 20 分的每小時 180 公里,陣風達每小時 212 公里 (其後修訂為每小時 220 公里)。不久後大老山錄得持續風速為每小時 189 公里,陣風更達每小時 256 公里。長洲泳灘、青洲及大美督均於約 11 時錄得颶風風速。有見及此,天文台將山竹的估計颶風圈半徑由 60 海里 (111 公里) 擴大至 90 海里 (167 公里),表示香港實處於颶風圈內。
山竹於正午左右到達香港以南,本港風向漸轉偏東。風暴於下午 1 至 2 時間最接近香港,於西南偏南方約 100 公里處掠過。由於香港持續受山竹環流內的狂風吹襲,此時風勢仍然猛烈。隨著風向轉為東至東南,先前受屏蔽的地方如長洲、啟德、京士柏、流浮山、赤柱及天星碼頭變得當風,風勢於下午明顯增強。長洲於下午約 2 時錄得最高持續風速為每小時 165 公里 (其後修訂為每小時 173 公里),陣風為每小時 213 公里 (其後修訂為每小時 212 公里)。另一參考測風站西貢亦錄得持續風速達每小時 118 公里的颶風水平,而赤鱲角的風力亦幾乎達颶風程度。於香港錄得的風速完全推翻一些官方機構如日本氣象廳及台灣中央氣象局對山竹的強度估計。天文台於其熱帶氣旋報告中表示於維港內的北角站曾錄得持續風速達每小時 124 公里的颶風程度,為該站自 1998 年啟用以來首次錄得持續颶風。
狂風以外,山竹靠近亦捲入大量海水。雖然風暴並非於大潮時間來襲,但它仍然帶來十分嚴重的風暴潮。鰂魚涌、大澳及大埔滘的海水高度下午曾分別達 3.88、4.71 及 3.85 米,對應的風暴潮 (即實測海水高度減去預測潮汐高度) 分別為 2.35、3.40 及 2.42 米。天文台其後確認鰂魚涌及大埔滘的風暴潮是有紀錄以來最高,即打破颱風溫黛及荷貝襲港時所創下的紀錄。
山竹下午繼續向西北偏西移動,並於約 5 時登陸台山一帶。隨著山竹遠離,本港風勢於下午 3 時後開始緩和,而長洲及橫瀾島的風勢亦於 5 時前回落至暴風程度。雖然如此,天文台表示十號信號將會維持數小時,其後表示會於下午 7 至 10 時間改發八號信號。由於雨勢減弱,天文台於下午 6 時 50 分改發黃色暴雨警告信號,取代紅雨警告。最終,天文台確認颶風已遠離香港,於下午 7 時 40 分改發八號東南烈風或暴風信號,山竹當時位於香港以西約 240 公里。十號信號總共生效 10 小時,比 1999 年颱風約克於同日襲港時的 11 小時略短,為有紀錄以來第二最長的十號信號。改發信號時,長洲、沙洲及橫瀾島仍然吹暴風,而赤鱲角、啟德、西貢、赤柱及大老山則吹烈風。
由於山竹的外圍雨帶於晚間繼續影響本港,風勢於 17 日午夜前仍然強勁。黃色暴雨警告信號及新界北部水浸特別報告分別於下午 10 時 30 分及 11 時 30 分取消。隨著風力進一步緩和,天文台於 17 日上午 5 時 20 分改發三號強風信號,而長洲於破曉時份仍間中吹烈風。17 日天氣逐漸好轉,天文台於下午 2 時 40 分、山竹距港約 720 公里之時改發一號戒備信號。該信號最終於下午 7 時 10 分取消,不久後山竹亦離開香港 800 公里範圍。
山竹的狂風影響香港時間甚長,並引發重大風暴潮,其嚴重程度是香港於過去 35 年來未見的。因此,山竹為香港帶來廣泛破壞,以下列舉一些例子:
- 由山竹的風暴潮引發的水浸比去年天鴿來襲時更為廣泛。杏花邨的地下停車場繼天鴿後又一次被淹沒,而附近地面設施亦不能倖免。雖然大澳部分地區已安裝水閘,但亦被海水超越,導致住宅及商鋪出現水浸情況。城門河河水氾濫,而將軍澳部分地區亦出現嚴重水浸。
- 受強風或外物敲打,不少高樓大廈有玻璃幕牆破裂。紅磡海濱廣場出現大範圍玻璃幕牆爆破,受影響的辦公室被吹至凌亂不堪。
- 東面當風的地點如將軍澳、西貢及石澳受大浪波及,河堤受損;無數船隻擱淺,災後海面有大量垃圾需要清理。
- 部分地區水電供應中斷,受影響的戶數曾超過一萬。
- 西貢污水處理廠於風災中受損,預計需時數月修理才能回復正常服務。
風暴中逾 400 人受傷並前往公立醫院的急症室求診。16 日機場共有 889 班航班取消;政府初時共接獲接近 15,000 宗塌樹報告*,是天鴿來襲時的 20 倍以上。由於大量路面因塌樹而被封閉或有危險,教育局宣布所有學校 (中學及以下) 於 17 及 18 日停課,而多間大學亦於 17 日停課。然而,塌樹令大部分巴士路線無法正常行駛,加上東鐵線及輕鐵部分路段仍然暫停服務,17 日有大批上班人士被逼滯留於鐵路站達數小時。雖然主流意見認為政府於風暴來襲前的準備工作有效減少受災程度,但政府亦因未能預見復工日的交通狀況而備受批評。
另一邊廂,雖然澳門比香港更接近山竹中心,但因澳門未受山竹最猛烈的雨帶侵襲,當地風勢較香港弱。澳門低窪地區一如天鴿吹襲時般出現水浸,而娛樂場則首次因風災而暫停營業。可幸的是,澳門汲取了去年天鴿重創的教訓,加上提早採取預防措施,山竹並未造成任何人死亡。
* 其後修訂至超過 6 萬宗樹木倒塌個案。
| Image Gallery 圖片庫 |
Additional figures and video footages on MANGKHUT and its impact are available at HKO's website.
香港天文台的網頁上有更多關於山竹及其影響之圖片及短片。

Figure 1 - Radar image at Guam before MANGKHUT's approach
圖 1 - 山竹吹襲關島前之雷達圖
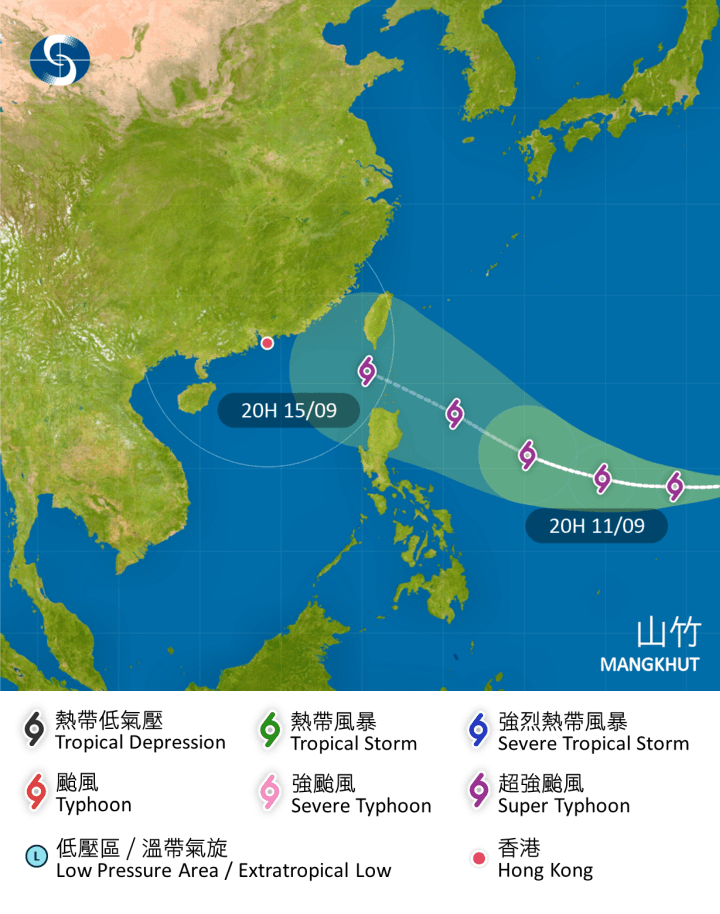

Figure 2 - Track forecast by the HKO at 8 pm September 10 (left) and 8 pm September 11 (right)
圖 2 - 9 月 10 日 (左) 及 11 日 (右) 天文台之預測路徑

Figure 3 - Track probability forecast by the HKO on September 11
圖 3 - 9 月 11 日天文台路徑概率預報
Figure 4 - Forecast track by the JTWC on September 11
圖 4 - 9 月 11 日聯合颱風警報中心之預測路徑圖

Figure 5 - Forecast tracks from various official agencies on September 11
圖 5 - 9 月 11 日各官方氣象台之預測路徑圖


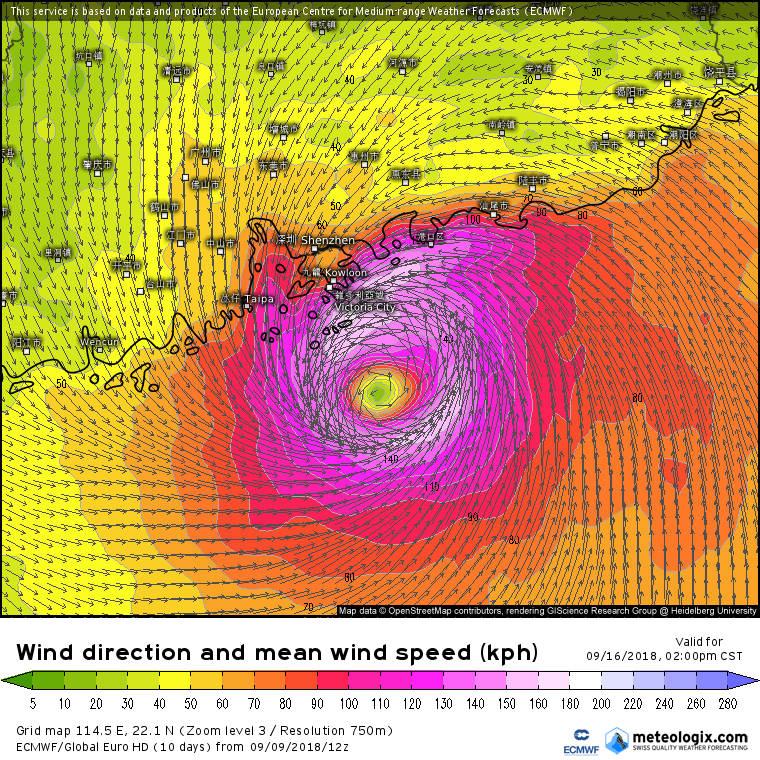
Figure 6 - ECMWF ensemble forecast track on September 9 (left), predicted mean sea level pressure (middle) and wind field (right) for September 16. Taken from meteologix.com.
圖 6 - 9 月 9 日 ECMWF 的集成預報 (左),預測於 16 日之平均海平面氣壓 (中) 及風場 (右)。於 meteologix.com 擷取。
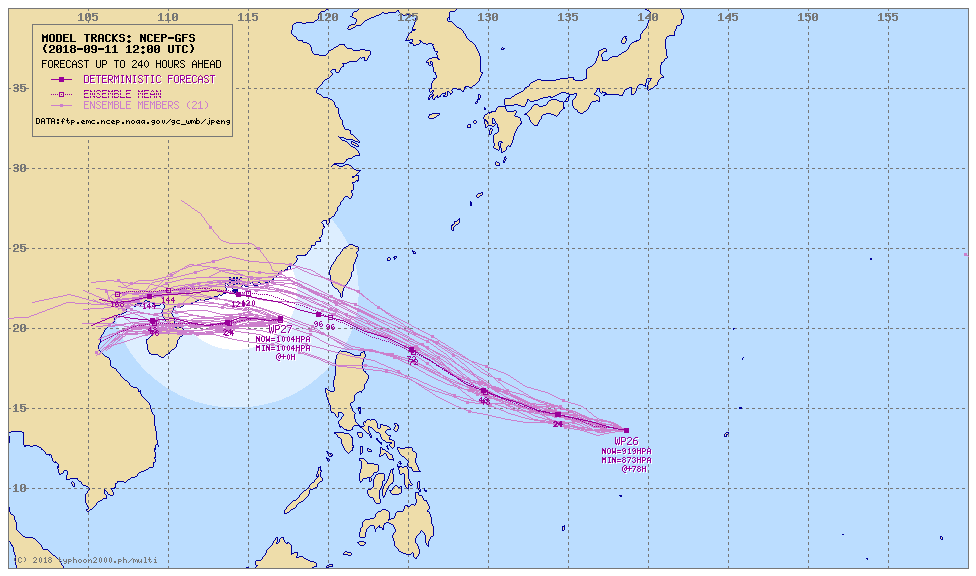


Figure 7 - GFS ensemble forecast track on September 11 (left), predicted mean sea level pressure (middle) and wind field (right) for September 16. Taken from typhoon2000.ph / meteologix.com.
圖 7 - 9 月 11 日 GFS 的集成預報 (左),預測於 16 日之平均海平面氣壓 (中) 及風場 (右)。於 typhoon2000.ph / meteologix.com 擷取。

Figure 8 - Deterministic numerical model forecast tracks on September 11. Taken from typhoon2000.ph.
圖 8 - 9 月 11 日部分數值模式之確定性預測路徑圖。於 typhoon2000.ph 擷取。

Figure 9 - 9-day weather forecast by the HKO on September 13, predicting the occurrence of force 10 winds on September 16.
圖 9 - 9 月 13 日天文台九天天氣預報,預計 16 日風力達 10 級


Figure 10 - Satellite imagery of MANGKHUT early on September 13
圖 10 - 9 月 13 日凌晨山竹之衛星雲圖

Figure 11 - Wind field analysis at 8:11 pm September 13. Note MANGKHUT's extensive circulation.
圖 11 - 9 月 13 日下午 8 時 11 分之風場掃描圖,留意山竹的環流龐大
Figure 12 - Steering flow chart on September 13. The subtropical ridge is strengthening east of MANGKHUT.
圖 12 - 9 月 13 日之駛流場圖,顯示副熱帶高壓脊正於山竹以東增強
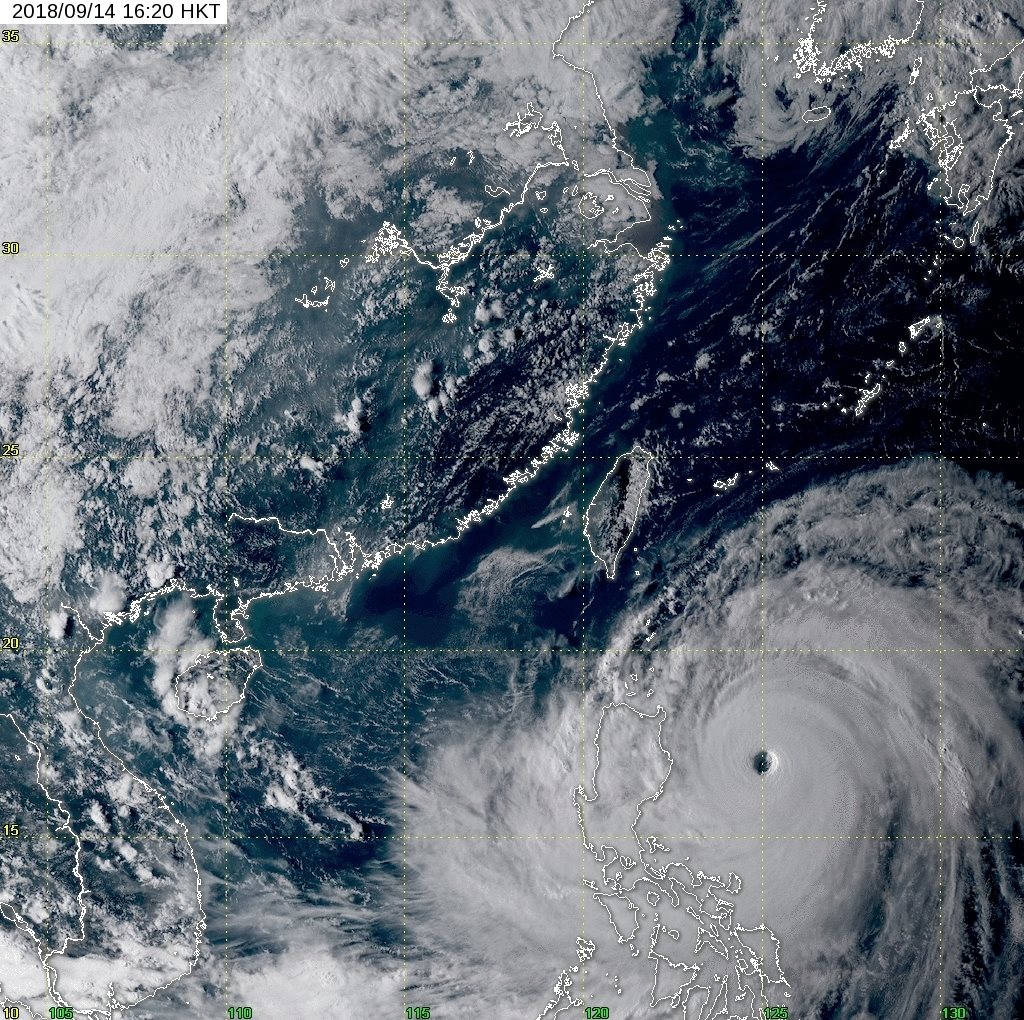

Figure 13 - Satellite imagery of MANGKHUT before (left) and after (right) making landfall at northern Philippines
圖 13 - 山竹登陸菲律賓北部前 (左) 及後 (右) 之衛星雲圖


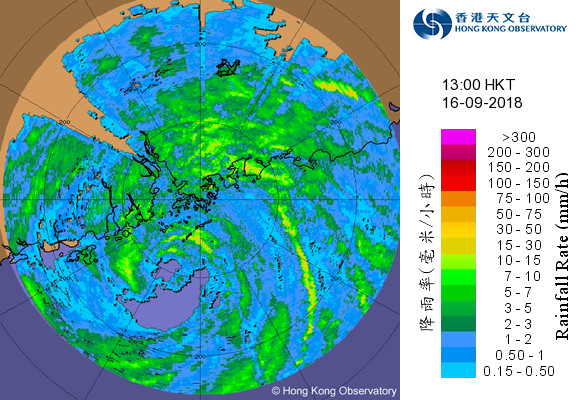

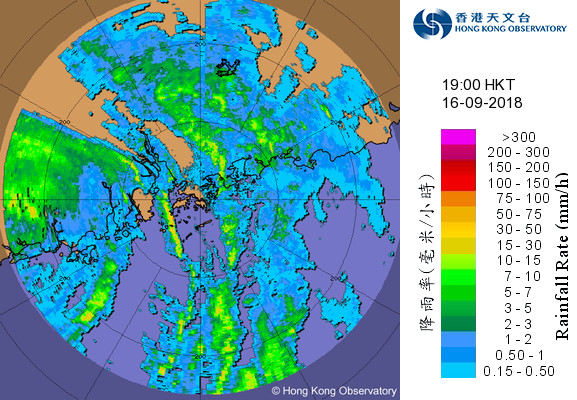
Figure 14 - Radar images at 3-hour intervals from 4 am to 7 pm September 16
圖 14 - 9 月 16 日上午 4 時至下午 7 時每三小時之雷達圖
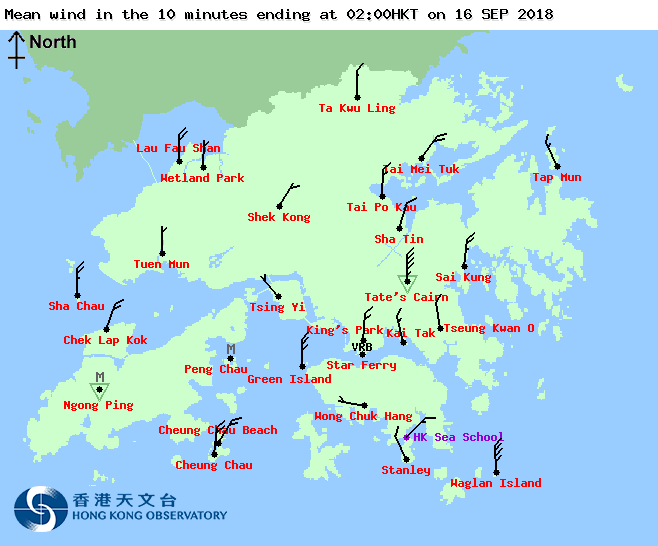

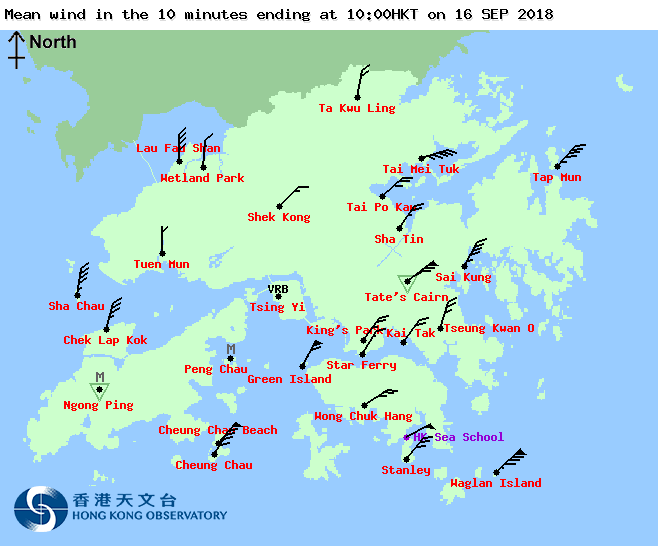

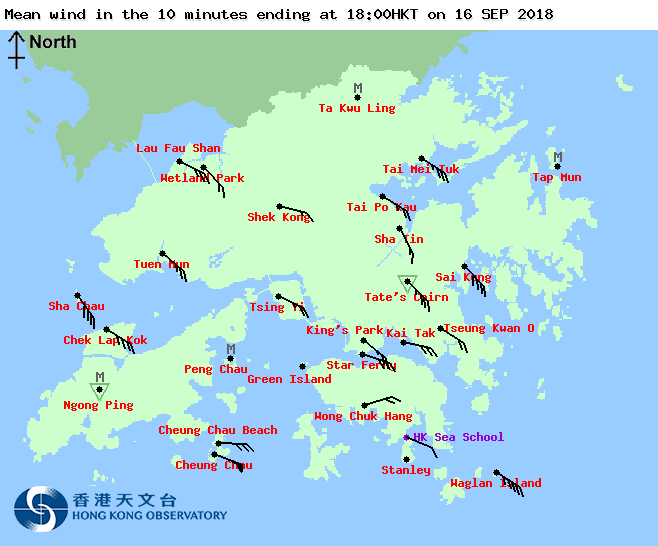
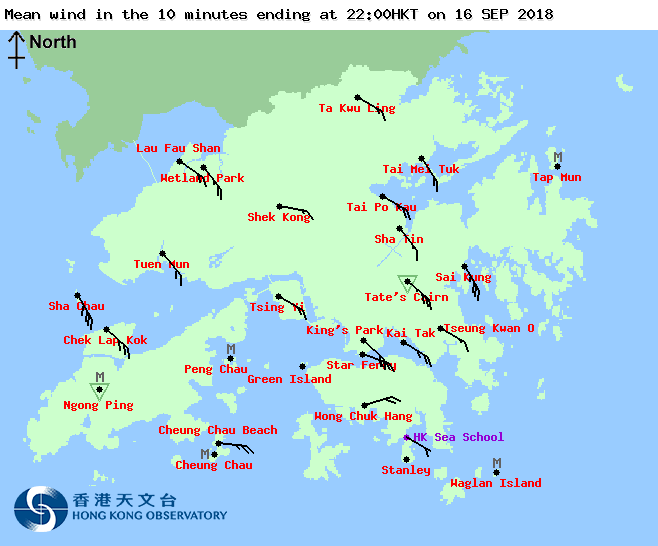
Figure 15 - Local wind distribution maps at 4-hour intervals from 2 am to 10 pm September 16
圖 15 - 9 月 16 日上午 2 時至下午 10 時每四小時之本港風勢分布圖
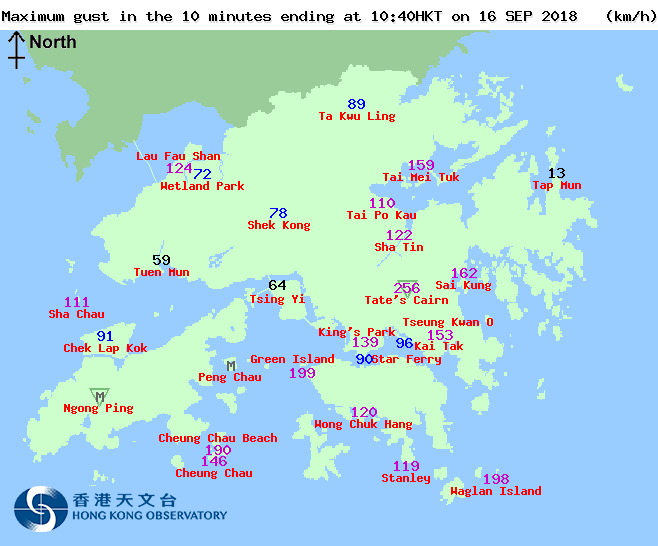

Figure 16 - Maximum gusts at 10:40 am (left) and 2:10 pm (right) September 16
圖 16 - 9 月 16 日上午 10 時 40 分 (左) 及下午 2 時 10 分 (右) 的之最高陣風圖

Figure 17 - Wind field analysis at 9:39 am September 16. Storm force winds were affecting Hong Kong.
圖 17 - 9 月 16 日上午 9 時 39 分之風場掃描圖,顯示香港正受暴風影響

Figure 18 - Satellite image of MANGKHUT at its closest point of approach to Hong Kong
圖 18 - 山竹最接近香港時之衛星雲圖

Figure 19 - Forecast track and estimated wind radii by the HKO at 2 pm September 16. Note that Hong Kong is within MANGKHUT's hurricane radius.
圖 19 - 9 月 16 日下午 2 時之預測路徑及估計風圈圖,留意香港處於颶風圈內
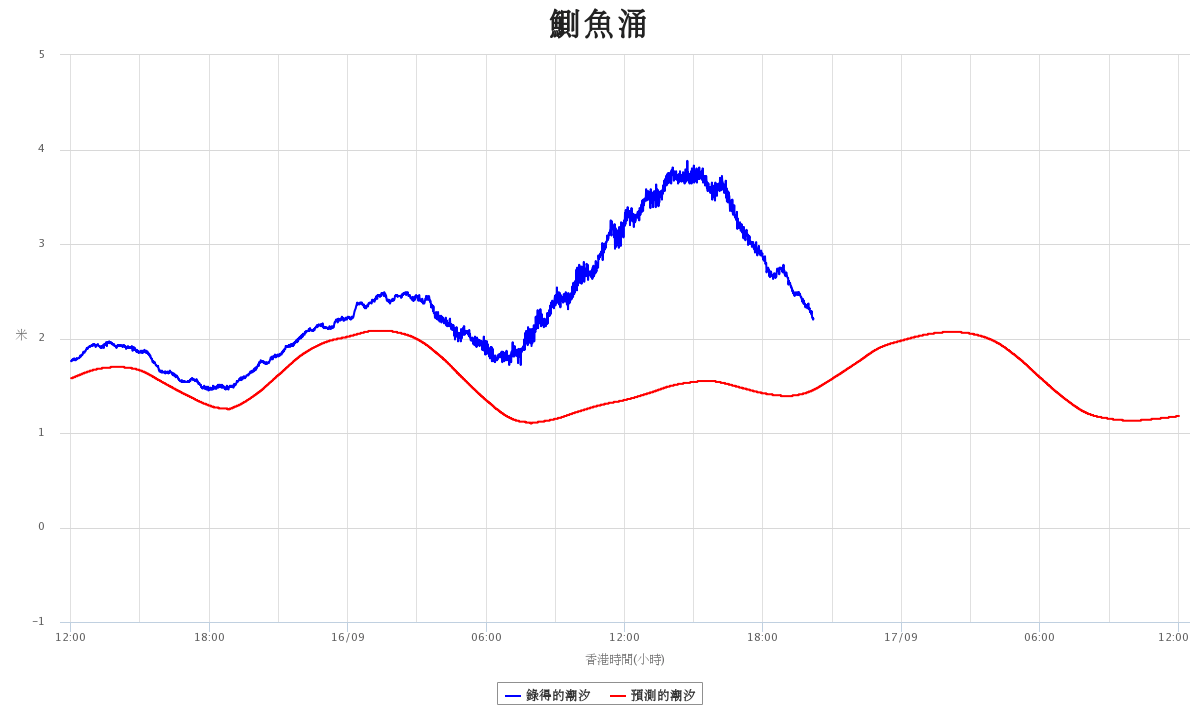


Figure 20 - Observed sea level and predicted tide at Quarry Bay, Tai Po Kau and Tai O (top to bottom) on September 16
圖 20 - 9 月 16 日鰂魚涌、大埔滘及大澳 (上至下) 之實測海水高度及預測潮汐圖

Figure 21 - Observed sea level and predicted tide in Macau on September 16
圖 21 - 9 月 16 日澳門之實測海水高度及預測潮汐圖


Figure 22 - Wind speed time series at Cheung Chau, Kai Tak, Sai Kung, Kowloon Star Ferry Pier, Tai Mei Tuk, Tate's Cairn and Waglan Island (top to bottom) on September 16. [Please click here for the updated charts released in HKO's TC report; the maximum wind speed at Cheung Chau was revised to 173 km/h.]
圖 22 - 長洲、啟德、西貢、九龍天星碼頭、大美督、大老山及橫瀾島 (上至下) 於 9 月 16 日之風速時間序列圖 [請按此瀏覽天文台於熱帶氣旋報告中發表的更新圖表;長洲的最高風速修訂為每小時 173 公里。]
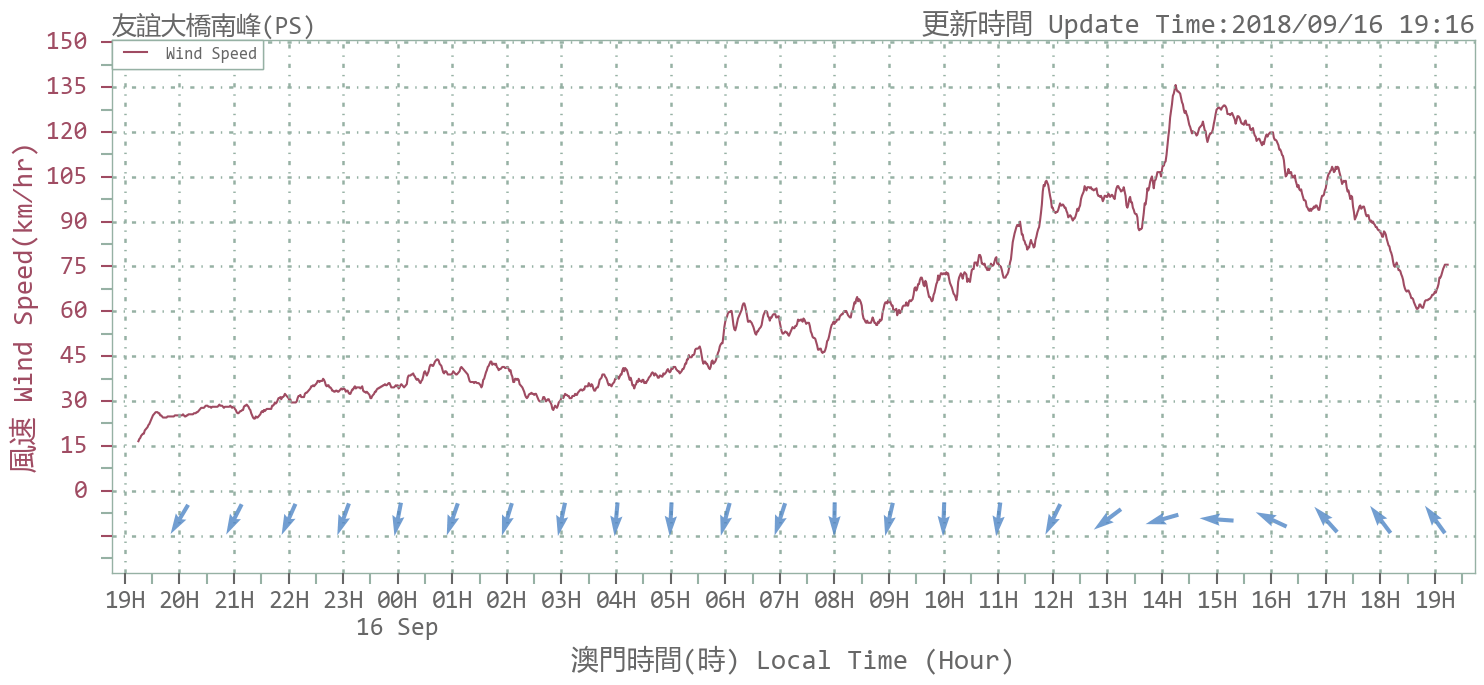
Figure 23 - Wind speed/direction time series at Amizade Bridge (South) of Macau on September 16
圖 23 - 澳門友誼大橋南峰於 9 月 16 日之風速風向時間序列圖


Figure 24 - Mean sea level pressure time series at Cheung Chau, Hong Kong Observatory and Waglan Island (top to bottom) on September 16
圖 24 - 長洲、香港天文台及橫瀾島 (上至下) 於 9 月 16 日之平均海平面氣壓序列圖

Figure 25 - Rainfall distribution map of September 16
圖 25 - 9 月 16 日之雨量分佈圖


Figure 26 - Maximum 10-minute average wind speed (left) and maximum gusts (right) recorded on September 16
圖 26 - 9 月 16 日錄得之最高十分鐘平均風速 (左) 及最高陣風 (右)
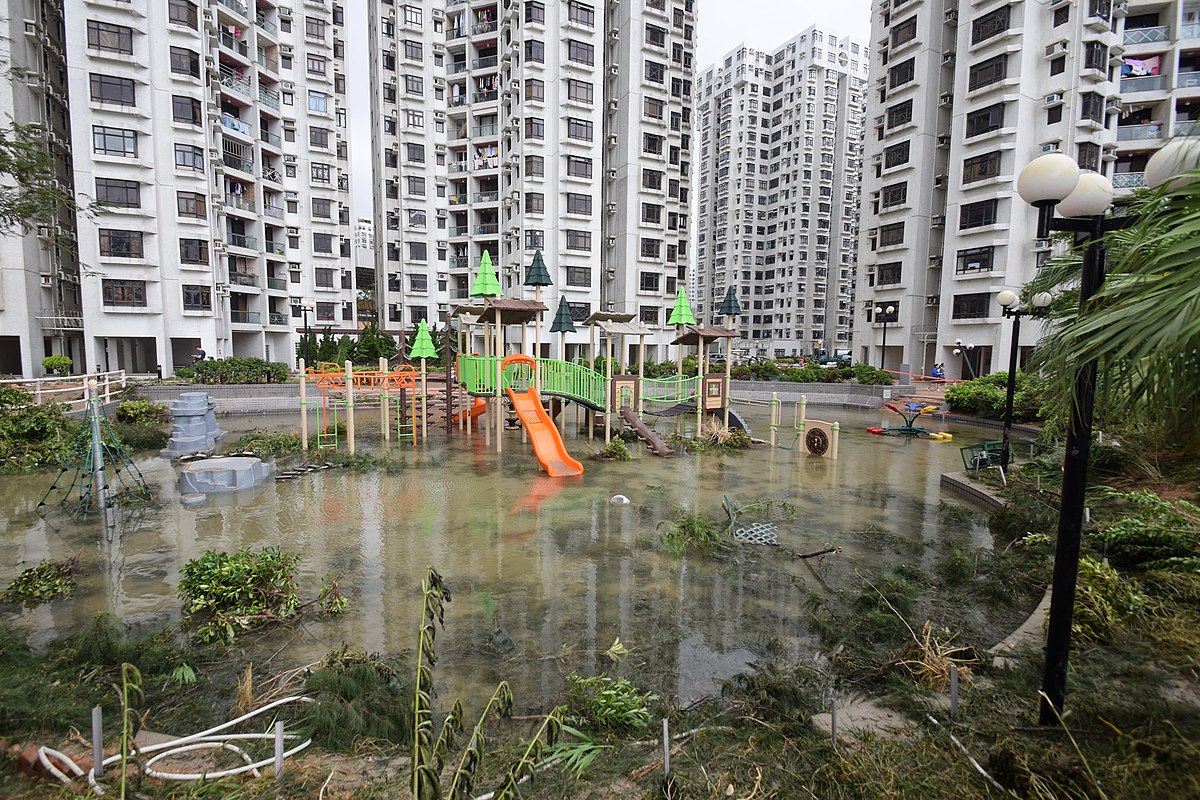

Figure 27 - Aftermath at Heng Fa Chuen after MANGKHUT's approach (top image from Wikipedia; bottom image from HK Incident Facebook group)
圖 27 - 山竹吹襲後杏花邨的情況 (上圖取自維基百科;下圖取自香港突發事故報料區 Facebook 群組)

Figure 28 - Surge in the water level at the Shing Mun River during MANGKHUT's approach (from HK Incident Facebook group)
圖 28 - 山竹吹襲時城門河水位上漲 (取自香港突發事故報料區 Facebook 群組)

Figure 29 - Glass panels at The Harbourfront, Hung Hom, damaged during MANGKHUT's approach (from HK Incident Facebook group)
圖 29 - 紅磡海濱廣場大範圍玻璃幕牆於山竹襲港時損毀 (取自香港突發事故報料區 Facebook 群組)

Figure 30 - A section of Kennedy Road completely blocked by fallen trees (Internet)
圖 30 - 堅尼地道部分路段被塌下的大樹完全阻塞 (網上圖片)


Figure 31 - Aftermath at Tseung Kwan O (top) and Shek O (bottom) after MANGKHUT's approach (from HK Incident Facebook group)
圖 31 - 山竹吹襲後將軍澳 (上) 及石澳 (下) 的情況 (取自香港突發事故報料區 Facebook 群組)


Figure 32 - Century-old gas lamps at Duddell Street damaged by fallen trees (left). The figure on the right shows the original condition of the lamps (left image from HK Incident Facebook group; right image from Wikipedia)
圖 32 - 都爹利街有百年歷史的煤氣燈被塌樹折斷 (左)。右圖為煤氣燈原貌。 (左圖取自香港突發事故報料區 Facebook 群組;右圖取自維基百科)
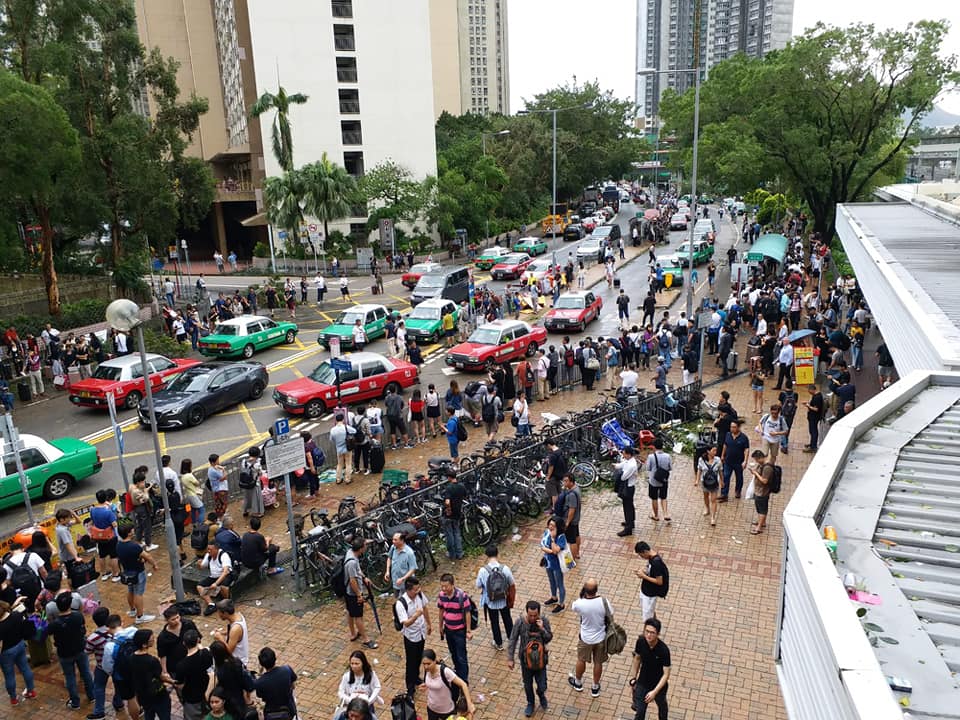
Figure 33 - Long queues of commuters waiting for taxis outside the Sheung Shui Railway Station on September 17 (from HK Incident Facebook group)
圖 33 - 9 月 17 日大批上班人士於上水鐵路站外等候的士 (取自香港突發事故報料區 Facebook 群組)

Figure 34 - Table of maximum 60-minute average wind speeds during the passage of typhoons necessitating the #10 Hurricane Signal in Hong Kong
圖 34 - 引致香港天文台發出十號颶風信號的颱風襲港時最高 60 分鐘平均風速列表
| Winds Recorded at Reference Stations 參考站所錄得的風速 |
Wind speeds here are based on a document presented in a District Council meeting in November 2018 (Link in Chinese).
下列風速取自一份於 2018 年 11 月提交至區議會的文件中所列數字。
| Station 風速站 |
Max. 10-min avg. wind speed 最高十分鐘平均風速 |
Beaufort classification 蒲福氏風級分類 |
| Chek Lap Kok 赤鱲角 | 115 km/h | STORM 暴風 |
| Cheung Chau 長洲 | 173 km/h | HURRICANE 颶風 |
| Kai Tak 啟德 | 90 km/h | STORM 暴風 |
| Lau Fau Shan 流浮山 | 110 km/h | STORM 暴風 |
| Sai Kung 西貢 | 118 km/h | HURRICANE 颶風 |
| Sha Tin 沙田 | 58 km/h | STRONG 強風 |
| Ta Kwu Ling 打鼓嶺 | 62 km/h | STRONG 強風 |
| Tsing Yi (SHL) 青衣蜆殼油庫 | 63 km/h | GALE 烈風 |
| Number of stations recording at least STRONG force (force 6 - 7) winds: | 8 |
| Number of stations recording at least GALE force (force 8 - 9) winds: | 6 |
| Number of stations recording at least STORM force (force 10 - 11) winds: | 5 |
| Number of stations recording HURRICANE force (force 12) winds: | 2 |
| 錄得 強風 (6 - 7 級) 或更高風速的站數: | 8 |
| 錄得 烈風 (8 - 9 級) 或更高風速的站數: | 6 |
| 錄得 暴風 (10 - 11 級) 或更高風速的站數: | 5 |
| 錄得 颶風 (12 級) 風速的站數: | 2 |
| Charts and Figures 各項數據 |
Table 1: Track data from HKWW:
表一 : 香港天氣觀測站之路徑資料
YYMMDDZZ Lat Long Wind |
Table 2: Maximum gust and hourly average wind speed recorded in Hong Kong from HKO:
表二 : 香港天文台公佈的各站最高每小時平均風力和陣風數據 (英文)
| Station | Maximum Gust | Maximum Hourly Mean Wind | ||||||
|---|---|---|---|---|---|---|---|---|
| Direction | Speed (km/h) |
Date/Month | Time | Direction | Speed (km/h) |
Date/Month | Time | |
| Bluff Head (Stanley) | - | 157 | 16/9 | 14:00 | - | 101 | 16/9 | 15:00 |
| Central Pier | E | 169 | 16/9 | 12:30 | E | 99 | 16/9 | 13:00 |
| Cheung Chau | E | 212 | 16/9 | 14:10 | E | 151 | 16/9 | 15:00 |
| Cheung Chau Beach | NE | 209 | 16/9 | 12:01 | ENE | 142 | 16/9 | 14:00 |
| Green Island | NNE | 229 | 16/9 | 10:29 | NE | 124 | 16/9 | 11:00 |
| Hong Kong International Airport | ESE | 157 | 16/9 | 16:26 | E | 99 | 16/9 | 15:00 |
| Kai Tak | ENE | 142 | 16/9 | 10:28 | ESE | 77 | 16/9 | 17:00 |
| ENE | 142 | 16/9 | 13:59 | |||||
| King's Park | NNE | 161 | 16/9 | 10:17 | E | 67 | 16/9 | 15:00 |
| Lau Fau Shan | ENE | 166 | 16/9 | 12:40 | ENE | 96 | 16/9 | 14:00 |
| North Point | E | 171 | 16/9 | 12:51 | E | 110 | 16/9 | 13:00 |
| Ping Chau | E | 124 | 16/9 | 11:30 | SSE | 47 | 16/9 | 11:00 |
| Sai Kung | NE | 180 | 16/9 | 11:43 | NE | 108 | 16/9 | 12:00 |
| Sha Chau | E | 164 | 16/9 | 14:02 | ESE | 103 | 16/9 | 15:00 |
| Sha Lo Wan | E | 169 | 16/9 | 14:11 | E | 87 | 16/9 | 15:00 |
| Sha Tin | NNE | 149 | 16/9 | 11:42 | NNE | 47 | 16/9 | 11:00 |
| Shek Kong | NE | 164 | 16/9 | 11:22 | E | 72 | 16/9 | 15:00 |
| Star Ferry (Kowloon) | E | 135 | 16/9 | 13:48 | E | 79 | 16/9 | 14:00 |
| Ta Kwu Ling | ENE | 133 | 16/9 | 13:28 | NNE | 52 | 16/9 | 11:00 |
| Tai Mei Tuk | ENE | 198 | 16/9 | 12:08 | ENE | 139 | 16/9 | 13:00 |
| Tai Mo Shan | ESE | 250 | 16/9 | 14:05 | ESE | 167 | 16/9 | 15:00 |
| Tai Po Kau | E | 146 | 16/9 | 13:09 | E | 88 | 16/9 | 13:00 |
| Tate's Cairn | ENE | 256 | 16/9 | 10:33 | ENE | 158 | 16/9 | 12:00 |
| Tseung Kwan O | NNE | 153 | 16/9 | 10:40 | NNE | 52 | 16/9 | 11:00 |
| Tsing Yi Shell Oil Depot | ESE | 137 | 16/9 | 14:22 | ESE | 58 | 16/9 | 15:00 |
| Tuen Mun Government Offices | E | 133 | 16/9 | 14:01 | SE | 51 | 16/9 | 17:00 |
| Waglan Island | NE | 220 | 16/9 | 10:14 | NE | 158 | 16/9 | 11:00 |
| Wetland Park | E | 130 | 16/9 | 13:06 | E | 58 | 16/9 | 14:00 |
| Wong Chuk Hang | ENE | 173 | 16/9 | 13:40 | ENE | 54 | 16/9 | 14:00 |
Table 3: Rainfall (in millimetres) contributed by MANGKHUT from HKO (figures in brackets are based on incomplete hourly data):
表三 : 香港天文台公佈的各站雨量資料 (英文) (方括號內之數據由不完整之每小時資料擷取)
| Station | 14-Sep | 15-Sep | 16-Sep | 17-Sep | Total rainfall (mm) | |
|---|---|---|---|---|---|---|
| Hong Kong Observatory (HKO) | 0.0 | Trace | 167.5 | 12.0 | 179.5 | |
| Hong Kong International Airport (HKA) | 0.0 | Trace | 191.5 | 4.2 | 195.7 | |
| Cheung Chau (CCH) | [0.0] | 0.0 | 79.0 | 9.0 | [88.0] | |
| H23 | Aberdeen | 0.0 | 0.0 | 99.0 | 7.5 | 106.5 |
| N05 | Fanling | 0.0 | 0.0 | 126.5 | 28.5 | 155.0 |
| N13 | High Island | 0.0 | 0.0 | [83.5] | 2.0 | [85.5] |
| K04 | Jordan Valley | 0.0 | 0.0 | 160.0 | 6.0 | 166.0 |
| N06 | Kwai Chung | 0.0 | 0.0 | 214.0 | 22.5 | 236.5 |
| H12 | Mid Levels | 0.0 | 0.0 | 143.0 | 22.0 | 165.0 |
| N09 | Sha Tin | 1.5 | 0.0 | 223.0 | 0.0 | 224.5 |
| H19 | Shau Kei Wan | 0.0 | 0.0 | 138.5 | 6.5 | 145.0 |
| SEK | Shek Kong | [0.0] | 0.0 | 279.0 | 41.5 | 320.5 |
| K06 | So Uk Estate | 0..0 | 0.0 | [253.0] | 17.0 | [270.0] |
| R31 | Tai Mei Tuk | 0.5 | 0.0 | [150.5] | [3.5] | [154.5] |
| R21 | Tap Shek Kok | 0.0 | 0.0 | 213.0 | 36.0 | 249.0 |
Last Accessed 最近訪問日期: Sat Apr 27 2024 07:40:15 HKT
Last Modified 最近修訂日期: Mon Jul 24 2023
