
Weather Info / 天氣資訊 > South China Weather Plots 華南天氣要素圖 [Refresh 更新]
 Latest Situation 最新形勢 Latest Situation 最新形勢 |
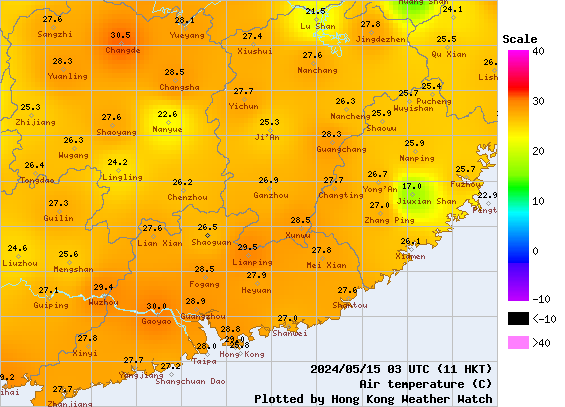
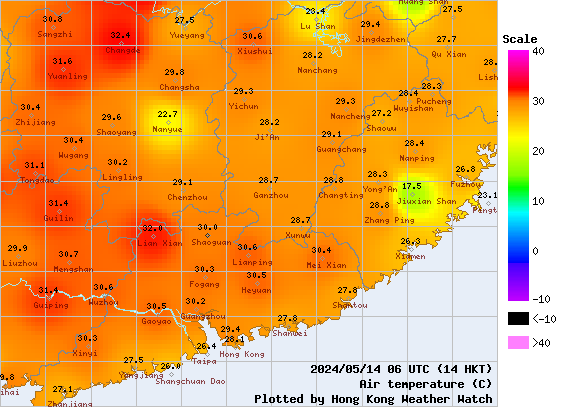
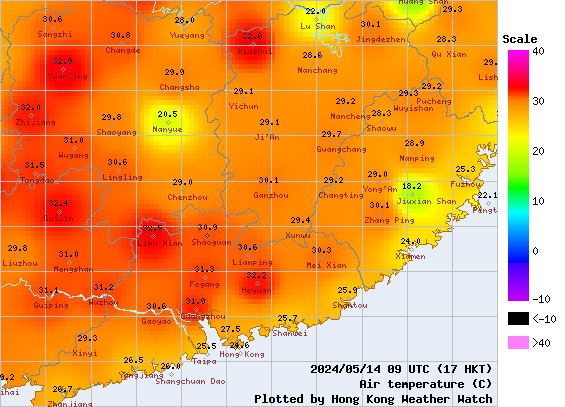
The following plots display distributions of different weather elements in southern China. Values for locations without measurement are computed using weighted linear estimates. Click on each thumbnail image to view at its original size. 下列圖像顯示華南各天氣要素的分佈。圖上沒有數據的地方利用加權平均值來估計。請在縮圖上按一下以顯示原圖。
 Air temperature 氣溫 |
 |
 Sea level pressure 海平面氣壓 |
|
 24-hr temp. chg. 24小時變溫 |
 24-hr SLP chg. 24小時變壓 |
||
 Dew point 露點溫度 |
 Relative humidity 相對濕度 |
 Visibility 能見度 |
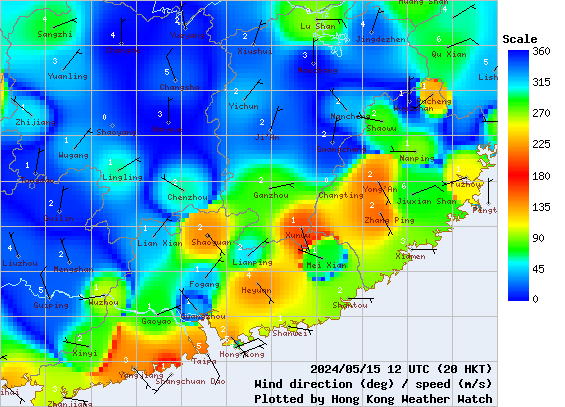 Wind 風 |
| Past 24 hours 過去 24 小時 |
The following plots show temperatures in the past 24 hours at 3-hour intervals. Move your cursor over each thumbnail image to view at its original size. 下列圖像顯示過去 24 小時的溫度,每 3 小時一幅。請移滑鼠至縮圖以顯示原圖。
Latest 最新 |
 3 hours before 三小時前 |
 6 hours before 六小時前 |
 9 hours before 九小時前 |
 12 hours before 十二小時前 |
 15 hours before 十五小時前 |
 18 hours before 十八小時前 |
 21 hours before 廿一小時前 |
 24 hours before 廿四小時前 |
|
||||||||
Last Accessed 最近訪問日期: Mon Apr 29 2024 13:25:04 HKT
Last Modified 最近修訂日期: Mon Jul 24 2023
