
TC Watch / 熱帶氣旋 > Selected TC Review / 重要熱帶氣旋回顧 > 202124W (KOMPASU 圓規) [Refresh 更新]
 202124W (KOMPASU 圓規) - Profile 檔案 202124W (KOMPASU 圓規) - Profile 檔案 |
(First draft issued on October 28, 2021, final version issued on January 11, 2022)
(初稿於 2021 年 10 月 28 日發出,最後版本於 2022 年 1 月 11 日上載)
Brief profile of KOMPASU | 圓規小檔案:
| JTWC number 聯合颱風警報中心 (JTWC) 號碼 | 24W |
| International number 國際編號 | 2118 |
| Period of existence 生存時期^ | 2021/10/08 14 HKT - 2021/10/14 20 HKT |
| Maximum 1-minute wind (JTWC) JTWC 一分鐘平均最高中心風速 | 55 knots 節 (Severe Tropical Storm equivalent 相當於強烈熱帶風暴級) |
| Minimum pressure (JTWC) JTWC 最低氣壓 | 980 hPa 百帕 |
| Highest TC signal by HKO 香港天文台發出最高熱帶氣旋警告信號 |
8 (NE) (Gale or Storm Signal 烈風或暴風信號) |
| Closest point of approach by HKO 香港天文台所示之最接近距離 |
S 360 km (real-time warning 實時報告 / TC report 熱帶氣旋報告) |
| Time of closest approach by HKO 香港天文台所示之最接近時間 |
2021/10/13 04 HKT (real-time warning 實時報告 / TC report 熱帶氣旋報告) |
| Lowest pressure recorded at HKO 香港天文台錄得的最低氣壓 |
997.3 hPa 百帕 (2021/10/13 03:04 HKT) |
^Refers to the period between the HK Observatory's first and last bulletins for the tropical cyclone (with at least tropical depression intensity). For storms formed/dissipated/transformed into an extratropical cyclone outside the area bounded by 7-36°N and 100-140°E, information from the JTWC will be used instead.
^即香港天文台為該熱帶氣旋 (熱帶低氣壓級或更高) 作出發佈的時期。至於在北緯 7 至 36 度、東經 100 至 140 度外形成/消散/轉化為溫帶氣旋的風暴,本網將參考聯合颱風警報中心的資料。
TC signals in Hong Kong* 香港曾經生效的熱帶氣旋警告*:
| Signal 信號 |
Date and time 日期和時間 |
Distance from HK 與香港的距離 |
Predicted movement 預測移動趨勢 |
Max. 10-min winds 中心最高十分鐘平均風速 |
 |
2021/10/12 (TUE) 00:40 HKT** | ESE 770 km | W at 25 km/h | 90 km/h (50 knots, STS) |
 |
2021/10/12 (TUE) 17:20 HKT | SE 470 km | W at 25 km/h | 110 km/h (60 knots, STS) |
|
2021/10/13 (WED) 16:40 HKT | SW 550 km | W at 22 km/h | 120 km/h (65 knots, T) |
 |
2021/10/14 (THU) 04:40 HKT | WSW 760 km | W at 18 km/h | 75 km/h (40 knots, TS) |
 |
2021/10/14 (THU) 06:20 HKT | WSW 780 km | W at 18 km/h | 75 km/h (40 knots, TS) |
*Based on the information from real-time tropical cyclone warning bulletins.
*根據實時熱帶氣旋警報資料。
**The #3 Strong Wind Signal was issued to replace the Strong Monsoon Signal.
**此三號強風信號取代強烈季候風信號。
Percentile rank among storms with #8 Signal (at compilation of this review)*: *This measures the relative wind strength in Hong Kong caused by this storm compared with others that share the same signal. 指標顯示此風暴相對於其他發出同樣信號的風暴為香港帶來之風力強度 For more information, please refer to Wind Speed Data for TCs that Have Affected Hong Kong. 更多資訊載於 影響香港氣旋之風速數據 頁 |
Overall: 總計: |
|
Moderately weak 中等偏弱 |
|||
| Component Ranks 分部等級 | ||||||
| Reference stations: 參考站: |
|
Moderately weak 中等偏弱 |
||||
| Victoria Harbour: 維多利亞港: |
|
Moderate 中等 |
||||
| Urban: 市區: |
|
Moderately weak 中等偏弱 |
||||
| Offshore & high ground 離岸和高地: |
|
Moderate 中等 |
||||
Cyclones that attained similar rating (with signal #8): HAGUPIT (2002), KENT (1995), GARY (1992) 相近級別之熱帶氣旋 (八號信號):黑格比 (2002)、肯特 (1995)、加里 (1992) |
||||||
IR imagery animation 紅外線雲圖動畫:
TC track from HKWW 本站的熱帶氣旋路徑圖:
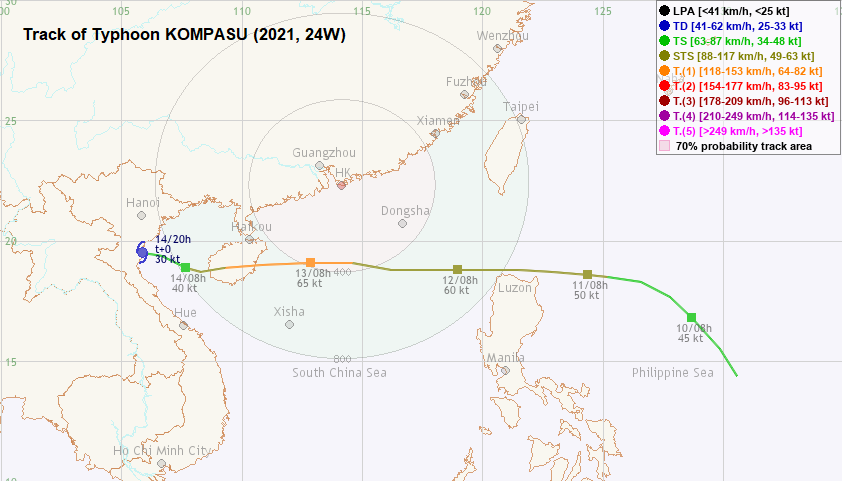
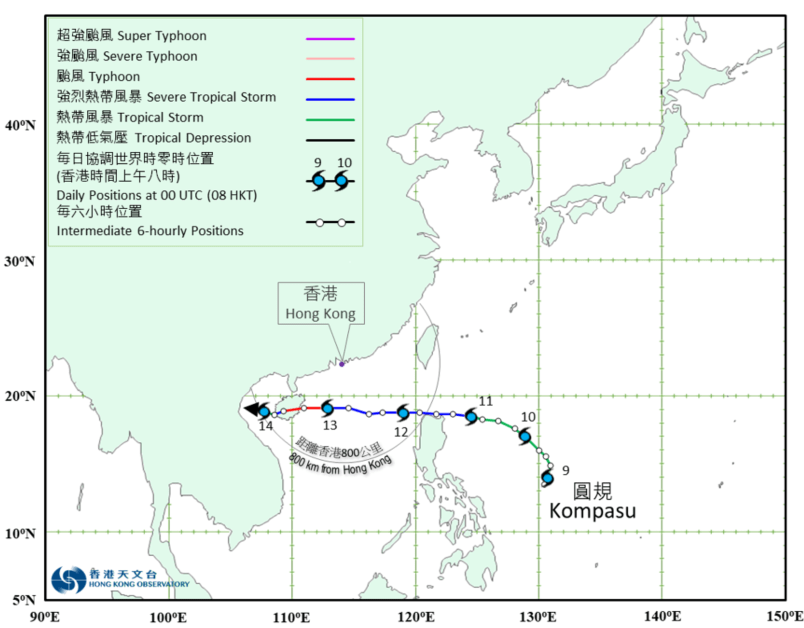
TC track from HKO 天文台的熱帶氣旋路徑圖:
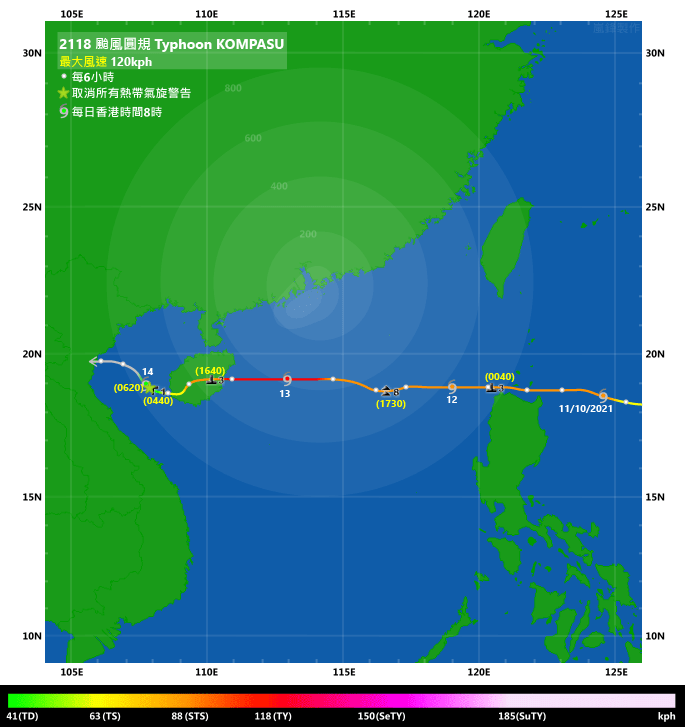
TC track with signal information 附有熱帶氣旋警告信號資料的路徑圖:
(Track figure courtesy of Lorenzo. Data from HKO. 鳴謝 Lorenzo 提供路徑圖,資料取自天文台)
| Past HKWW Bulletins 本站發佈 |
Please click here for bulletins on this tropical cyclone. 請按這裡。
| Storm Development Overview 風暴發展概覽 |
Unless otherwise stated, all times below are in Hong Kong Standard Time (UTC+8)
除非特別註明,下文時間均為香港標準時間 (協調世界時加 8 小時)
Two tropical disturbances, 93W and 94W, formed in the northwest Pacific east of the Philippines in early October. While both disturbances had a loose circulation centre, they were developing in the same broad area of low pressure. The JMA issued a gale warning in the night of October 7, with an estimated centre position that was closer to the western disturbance (93W). The centre was expected to move east or northeast before turning north, due to the gradual merger of the two systems. The NMC upgraded the area of low pressure into a tropical depression early on October 8.
93W and 94W still appeared as two separate systems on October 8. However, the JMA upgraded them into a tropical storm in the afternoon, naming it KOMPASU. The wind field analysis on that day failed to show a well-defined centre, but it was evident that the wind speed was much higher in the periphery of the disturbances than at the central location. At the time of the upgrade, the JMA estimated that KOMPASU's 30-kt wind field extended to about 500 NM (926 km) from the centre.
The convections of both systems strengthened in the night of October 8. The JTWC issued a tropical cyclone formation alert for 93W at 8 pm, and another one for 94W (which had then moved to the northeast of 93W) at 2 am October 9. The two systems continued to revolve around a barycentre in a counter-clockwise direction. The formation alert for 94W was reissued 24 hours later, and it was not until 2 pm October 10 that the JTWC believed the low-level circulation centre was well-defined enough to justify upgrading it into tropical storm 24W.
KOMPASU consolidated on October 10. In the small hours of October 11, convective bursts developed near its centre as the storm tracked west-northwestwards towards northern Luzon and the Luzon Strait. Due to the stable subtropical ridge in southern China at that time, KOMPASU was expected to maintain a mostly westerly motion into the South China Sea.
Various agencies upgraded KOMPASU into a severe tropical storm (or its equivalent strength) on October 11. The storm passed very close to the northern Luzon coast that night, and entered the South China Sea early on October 12. Convections were intense in KOMPASU's southern semicircle, as moisture was fed into the storm continuously by an active southwesterly airstream at the lower latitudes. KOMPASU maintained a forward speed of between 25 and 30 km/h as it travelled west in the South China Sea. On October 13, KOMPASU's core developed further, prompting both the NMC and HKO to upgrade it into a typhoon.
According to the NMC, KOMPASU made landfall near Qionghai, Hainan at around 3:40 pm October 13, packing force 12 winds of up to 33 m/s (119 km/h). The landfall location was close to that of tropical cyclone LIONROCK five days ago. Due to land interaction and the increase in vertical wind shear in the western part of the South China Sea, KOMPASU weakened readily as it crossed Hainan that night and even after it entered the Gulf of Tonkin. KOMPASU weakened into a tropical storm early on October 14, and further into a tropical depression later in the day. The storm degenerated into an area of low pressure near the Vietnamese coast by the end of October 14.
兩個熱帶擾動,93W 及 94W,於 10 月初在菲律賓以東的西北太平洋形成。雖然兩個擾動有各自的鬆散對流中心,但它們均於一廣闊低壓區內發展。日本氣象廳於 7 日晚上發出烈風警告,估計中心位置較接近西面的擾動 (93W),並預料該中心先向東至東北移動,其後隨著兩系統逐漸合併而轉向偏北。中國中央氣象台於 8 日早段將該低壓區升格為熱帶低氣壓。
10 月 8 日,93W 及 94W 看來仍然正在各自發展,但日本氣象廳於下午將它們升格為一個熱帶風暴,命名為圓規。當天的風場掃描並未顯示它有一清晰中心,但其周邊風速明顯較中心位置一帶為高。升格之時,日本氣象廳估計圓規的 30 節風場擴展至中心以外約 500 海里 (926 公里)。
兩擾動的對流於 10 月 8 日晚間增強。聯合颱風警報中心於下午 8 時對 93W 發出熱帶氣旋形成警報,並於 9 日上午 2 時對 94W 發出該警報,當時 94W 已移至 93W 的東北方,而兩擾動繼續繞一質心作逆時針轉動。對 94W 發出的形成警報於 24 小時後重新發佈,至 10 日下午 2 時聯合颱風警報中心才認為其低層環流中心已足夠清晰,將其升格為熱帶風暴 24W。
圓規於 10 月 10 日有所整固。11 日凌晨,圓規近中心有對流爆發,風暴向西北偏西移動,趨向呂宋北部及呂宋海峽。由於當時華南有一穩定副熱帶高壓脊盤據,預料圓規將大致西移並進入南海。
部分氣象機構於 10 月 11 日將圓規升格為強烈熱帶風暴 (或相等強度)。當晚風暴於呂宋北部近岸一帶海域通過,並於 12 日早段進入南海。由於低緯度西南氣流活躍,圓規持續得到濕氣供應,其南半圓對流猛烈。圓規於南海西移時維持大約每小時 25 至 30 公里的前進速度。圓規的中心於 13 日進一步發展,中央氣象台及香港天文台均將其升格為颱風。
根據中央氣象台,圓規於 10 月 13 日下午約 3 時 40 分登陸海南瓊海市一帶,非常接近五天前熱帶氣旋獅子山的登陸點,而登陸時風速達 12 級 (每秒 33 米或每小時 119 公里)。受地形及南海西部垂直風切變上升影響,圓規於當晚橫過海南及進入北部灣後迅速減弱。它於 14 日早段減弱為熱帶風暴,稍後減弱為熱帶低氣壓,最後於 14 日後段在越南沿岸附近減弱為低壓區。
| Weather in Hong Kong During Approach 風暴影響時香港天氣狀況 |
Link to relevant HKO weather report bulletins:
12/10 ●
13/10 ●
14/10
香港天文台相關天氣報告連結:12/10 ●
13/10 ●
14/10
Although KOMPASU was not expected to be close to Hong Kong, the storm's development received considerable attention from the public due to the influence of tropical cyclone LIONROCK and the controversies arising from it. The weather in Hong Kong was generally fine on October 11. In the afternoon, the HK Observatory mentioned that KOMPASU would come within 800 km of Hong Kong that night, and the Observatory would issue the #3 Strong Wind Signal to replace the Strong Monsoon Signal.
The #3 Signal was issued at 12:40 am October 12, when KOMPASU was 770 km east-southeast of Hong Kong. It was the second time in four days that the #3 Signal was issued directly, bypassing the #1 Standby Signal. Because of the northeast monsoon, strong northerly winds were observed in offshore waters and on high ground. As local winds were expected to strengthen when KOMPASU came closer, the Observatory expressed in its 10 am bulletin that it would consider issuing the #8 Signal later in the afternoon. The time of signal change was made more precise to between 4 and 6 pm two hours later. The Education Bureau announced near noon that all classes would be suspended for the rest of the day.
Sparse rainbands started to affect Hong Kong in the afternoon. The Pre-No. 8 Special Announcement issued at 3:20 pm gave the public a 2-hour warning prior to the signal upgrade. The traffic turned busy as workers started to go home; it was announced that local ferry services would gradually be suspended after 6 pm. After the warning period, the Observatory issued the #8 Northeast Gale or Storm Signal at 5:20 pm when KOMPASU was 470 km southeast of Hong Kong. It is possible that the #8 Signal was issued somewhat earlier to allow sufficient preparation time for the public, and to minimize the possibility of drawing further criticisms. At many locations especially those obstructed towards the north, winds did not pick up following the issuance of the #8 Signal, and were even weaker than in the late morning.
KOMPASU passed at a distance of around 360 km south of Hong Kong in the small hours of October 13. Rain had become more frequent by this time; winds started to strengthen as the wind direction turned to the northeast. Sustained hurricane force winds were recorded at Tate's Cairn, an elevated station. Storm force winds were recorded at Waglan Island, while gales affected locations such as Cheung Chau, Green Island, Ngong Ping and Tai Mei Tuk. Meanwhile, as KOMPASU's closest approach coincided with the time of the high tide, there were reports of flooding in low-lying areas such as Lei Yue Mun, Sha Tin and Tai O. At some tide gauges, the sea level was about 1 metre above normal high tide. The Observatory indicated that the #8 Signal would remain in force before noon.
As KOMPASU moved to Hong Kong's southwest quadrant, the wind direction turned east in the morning. More locations thus became exposed and the strongest winds were generally recorded in the late morning. Gales were observed at Peng Chau and Tap Mun, and the wind speeds at Central Pier and North Point (both within the Victoria Harbour) almost reached gale force. It is worth noting that the change in wind direction in the morning was associated with a significant increase in temperature of around 3 to 5 degrees, suggesting that Hong Kong was under the influence of the moist, warm airmass within KOMPASU's circulation. As winds were expected to remain strong, the Observatory mentioned at 10 am that the #8 Signal would remain in force by 4 pm.
The Amber Rainstorm Warning was issued at 2:02 pm as an intense rainband approached Hong Kong at that time. Many districts received 30 mm of rain in the hour between 2:45 and 3:45 pm, while around 50 mm was recorded at Lantau the hour before. As KOMPASU was expected to make landfall soon, the Observatory announced at 2 pm that it would consider issuing the #3 Signal between 4 and 7 pm, replacing the #8 Signal.
Local winds started to moderate following the passage of the intense rainband. The #3 Strong Wind Signal was issued at 4:40 pm, when KOMPASU was around 550 km southwest of Hong Kong, while the Amber Rainstorm Warning was cancelled at 5:10 pm. The #8 Northeast Gale or Storm Signal was in force for 23 hours 20 minutes, the longest for a single direction of the Gale or Storm Signal since tropical cyclone Mary in 1960. The two #8 Signals for tropical cyclones LIONROCK and KOMPASU were only 60 hours and 40 minutes apart, breaking the previous record (for #8 Signals necessitated by different tropical cyclones) of 75 hours 30 minutes in 1966.
The #3 Signal remained in force for 12 hours, before being replaced by the #1 Standby Signal at 4:40 am October 14. By that time, winds were only occasionally strong in offshore waters and on high ground. The #1 Signal was cancelled shortly after at 6:20 am, just as KOMPASU was exiting the 800-km precautionary area of Hong Kong.
During KOMPASU's approach, the government received around 72 reports of fallen trees and 10 flooding reports. 21 people were injured and received medical treatment at the Accident and Emergency Department of public hospitals; one man died of injuries sustained from a traffic accident in the afternoon of October 12.
雖然預料圓規不會太接近香港,但由於日前熱帶氣旋獅子山靠近並引發一些爭議,圓規的發展受大眾所關注。10 月 11 日香港大致天晴,下午天文台提及圓規將於晚上進入本港 800 公里範圍,屆時會以三號強風信號取代強烈季候風信號。
三號信號於 10 月 12 日上午 12 時 40 分發出,當時圓規位於香港東南偏東約 770 公里,而這是四天內第二度跳過一號戒備信號而直接發出三號信號。受東北季候風影響,離岸及高地吹強風程度的北風。由於預料圓規靠近時本地風勢會增強,天文台於上午 10 時表示將於下午較後時間考慮改發八號信號,並於兩小時後將改發信號時間收窄至下午 4 至 6 時。教育局於接近中午時份宣布當天所有學校停課。
下午稀疏的雨帶開始影響香港,天文台於下午 3 時 20 分發出預警八號熱帶氣旋警告信號之特別報告,給予公眾兩小時預警。報告發出後市民提早下班回家,交通一度繁忙,而船公司宣布港內渡輪服務將於下午約 6 時過後陸續停航。預警期過後,天文台於下午 5 時 20 分發出八號東北烈風或暴風信號,圓規集結於香港東南約 470 公里。此八號信號發出時間較早,有可能是為了讓公眾有充足時間做好防風措施,同時減低再引發爭議的風險。改發八號信號後,不少地方風勢並沒有增強,反而比早上後段還要弱,這情況於北方受屏蔽的地點尤為明顯。
圓規於 10 月 13 日凌晨於香港以南約 360 公里掠過,此時雨勢已變得較為頻密,而風勢亦隨著風向轉為東北而有所增強。位處高地的大老山錄得持續風速達颶風水平;橫瀾島吹暴風,而長洲、青洲、昂坪及大美督等地吹烈風。與此同時,由於圓規最接近香港之時剛好遇上漲潮,低窪地區如鯉魚門、沙田及大澳等地有水浸報告,而部分潮汐站海水高度比正常漲潮高出約 1 米。天文台表示八號信號將於中午前維持。
隨著圓規移至香港的西南象限,早上風向轉為偏東,變得當風的地點於上午較後時段錄得最高風速。坪洲及塔門吹烈風,而位於維港內的中環碼頭及北角風速幾乎達烈風水平。值得一提的是早上風向轉變時多區氣溫明顯上升 3 至 5 度,表示香港正受圓規環流中的濕暖氣團影響。由於預料風勢將維持強勁,天文台於上午 10 時表示八號信號將於下午 4 時前維持。
下午一道強雨帶靠近香港,天文台於下午 2 時 02 分發出黃色暴雨警告。多區於下午 2 時 45 分至 3 時 45 分的一小時間錄得約 30 毫米雨量,而大嶼山於之前的一小時錄得約 50 毫米。因預料圓規即將登陸,天文台於下午 2 時宣佈將於下午 4 至 7 時考慮改發三號信號,取代八號信號。
強雨帶過後本港風勢開始緩和。三號強風信號於下午 4 時 40 分發出,圓規當時位於香港西南約 550 公里,而黃色暴雨警告於下午 5 時 10 分取消。八號東北烈風或暴風信號共生效 23 小時 20 分鐘,是自 1960 年熱帶氣旋瑪麗以來單一方向烈風或暴風信號生效最長時間。熱帶氣旋獅子山及圓規的八號信號只相隔 60 小時 40 分鐘,打破先前兩氣旋間的八號信號最短相隔時間紀錄 (1966 年的 75 小時 30 分鐘)。
三號信號生效 12 小時後,於 10 月 14 日上午 4 時 40 分被一號戒備信號取代,當時只餘離岸及高地間中吹強風。隨著圓規即將離開香港 800 公里警戒範圍,一號信號於上午 6 時 20 分取消。
圓規靠近香港期間,政府接獲約 72 宗塌樹報告及 10 宗水浸報告。21 人受傷並於公立醫院急症室接受診治,其中一名男子於 10 月 12 日下午因交通意外受傷,送院搶救後不治。
| Image Gallery 圖片庫 |

Figure 1 - Steering flow chart at 8 am October 10
圖 1 - 10 月 10 日上午 8 時之駛流場分佈圖

Figure 2 - JMA's initial bulletin as it upgraded the broad area of low pressure into tropical storm status. Note the large estimated wind radius.
圖 2 - 日本氣象廳將該廣闊低壓區升格為熱帶風暴時的首次發佈,留意其估計風圈較大
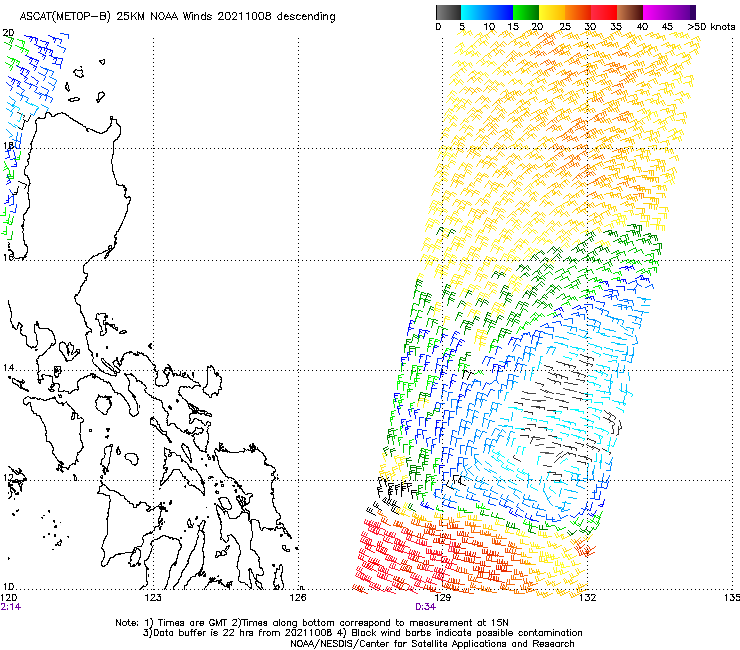
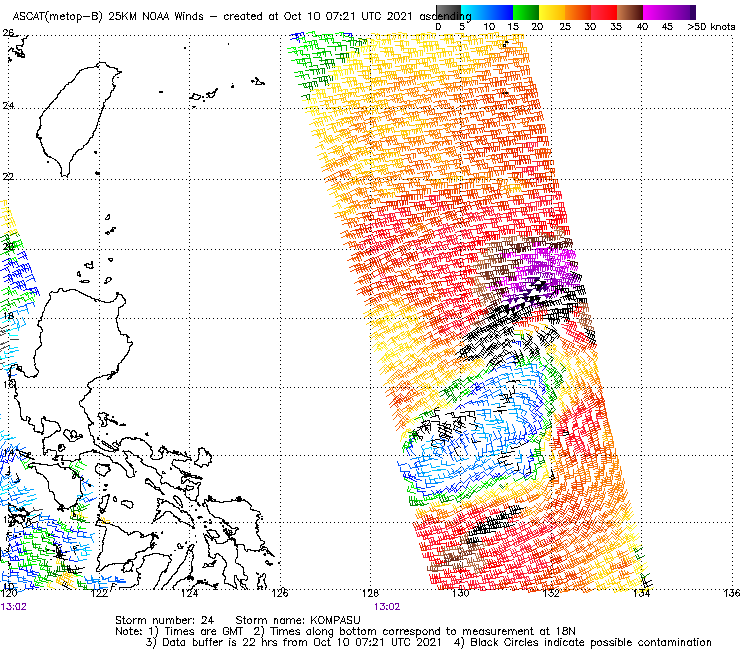
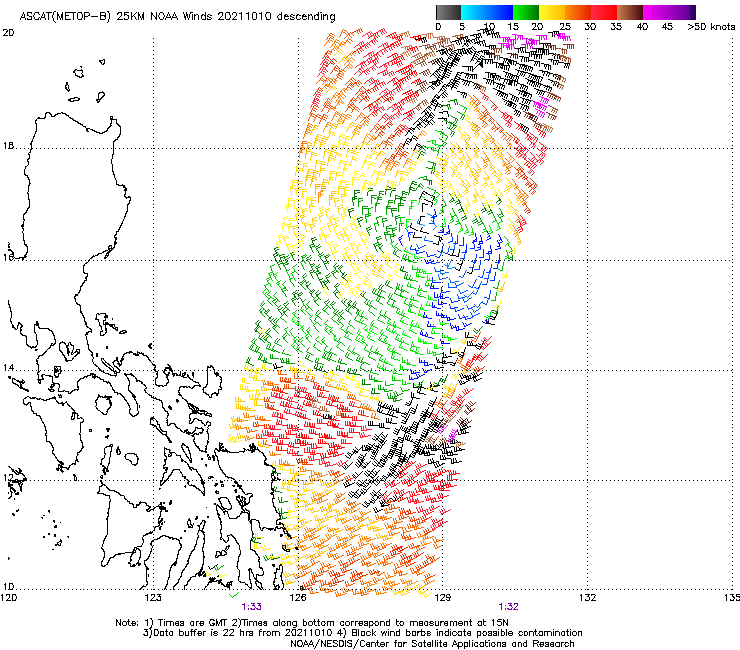
Figure 3 - Wind field analysis at 8:34 am October 8 (left), 9:02 pm October 9 (middle), and 9:33 am October 10 (right)
圖 3 - 10 月 8 日上午 8 時 34 分 (左)、9 日下午 9 時 02 分 (中) 及 10 日上午 9 時 33 分 (右) 之風場掃描
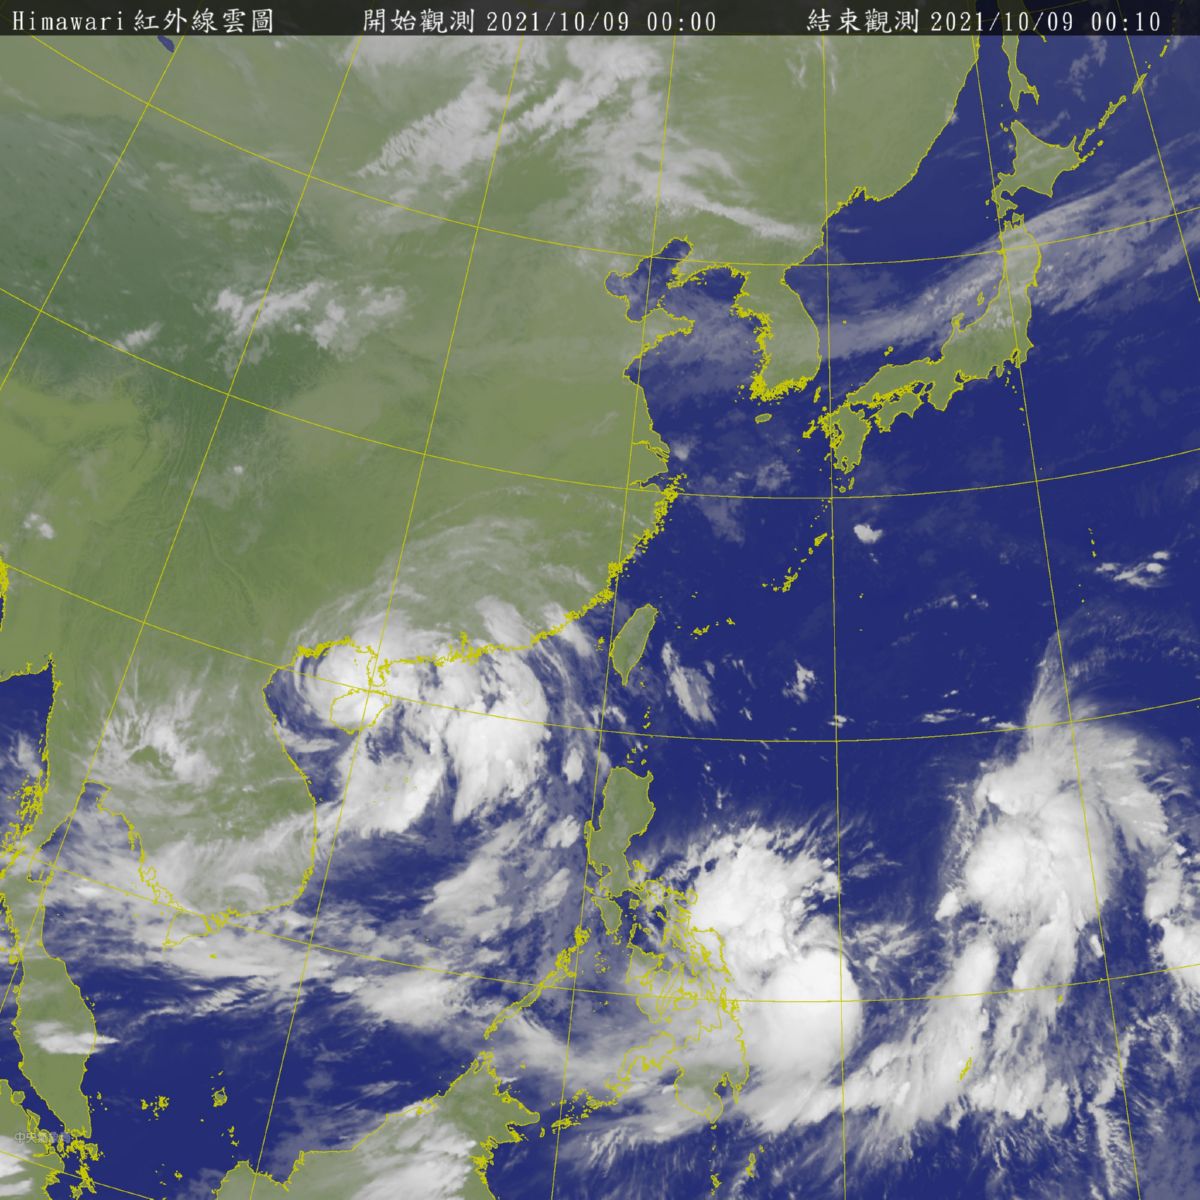
Figure 4 - Satellite image of 93W and 94W east of the Philippines on October 9. The cyclone at Hainan Island is LIONROCK.
圖 4 - 10 月 9 日位於菲律賓以東的 93W 及 94W 之衛星雲圖;位於海南島的是熱帶氣旋獅子山
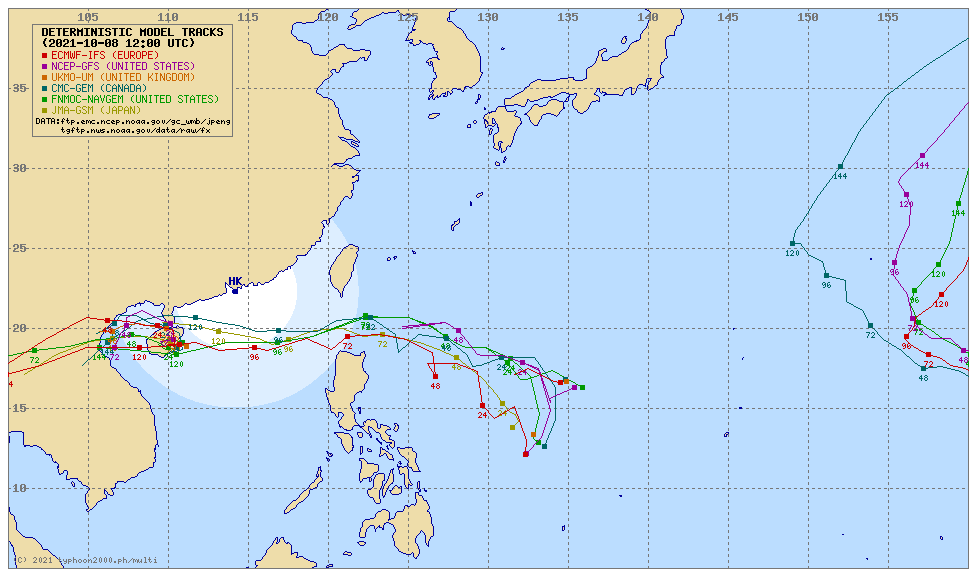
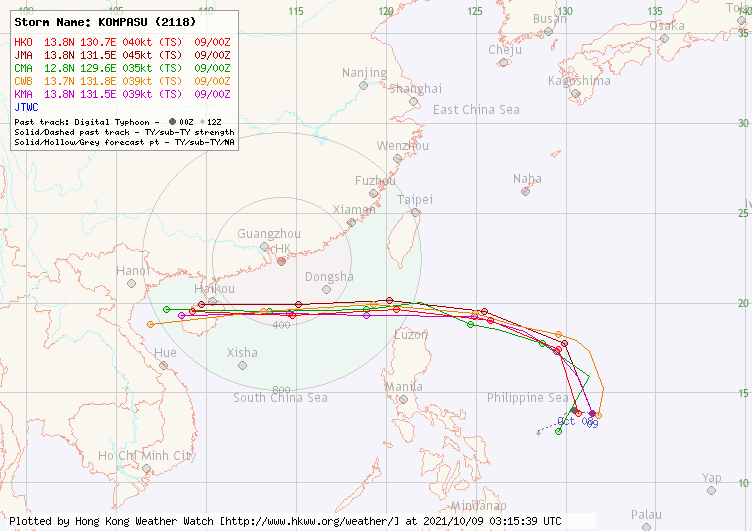
Figure 5 - Forecast tracks from various numerical models on October 8 (left, Typhoon2000.com) and official agencies on October 9 (right)
圖 5 - 10 月 8 日各數值模式 (左;Typhoon2000.com) 及 9 日各官方氣象台 (右) 之預測路徑
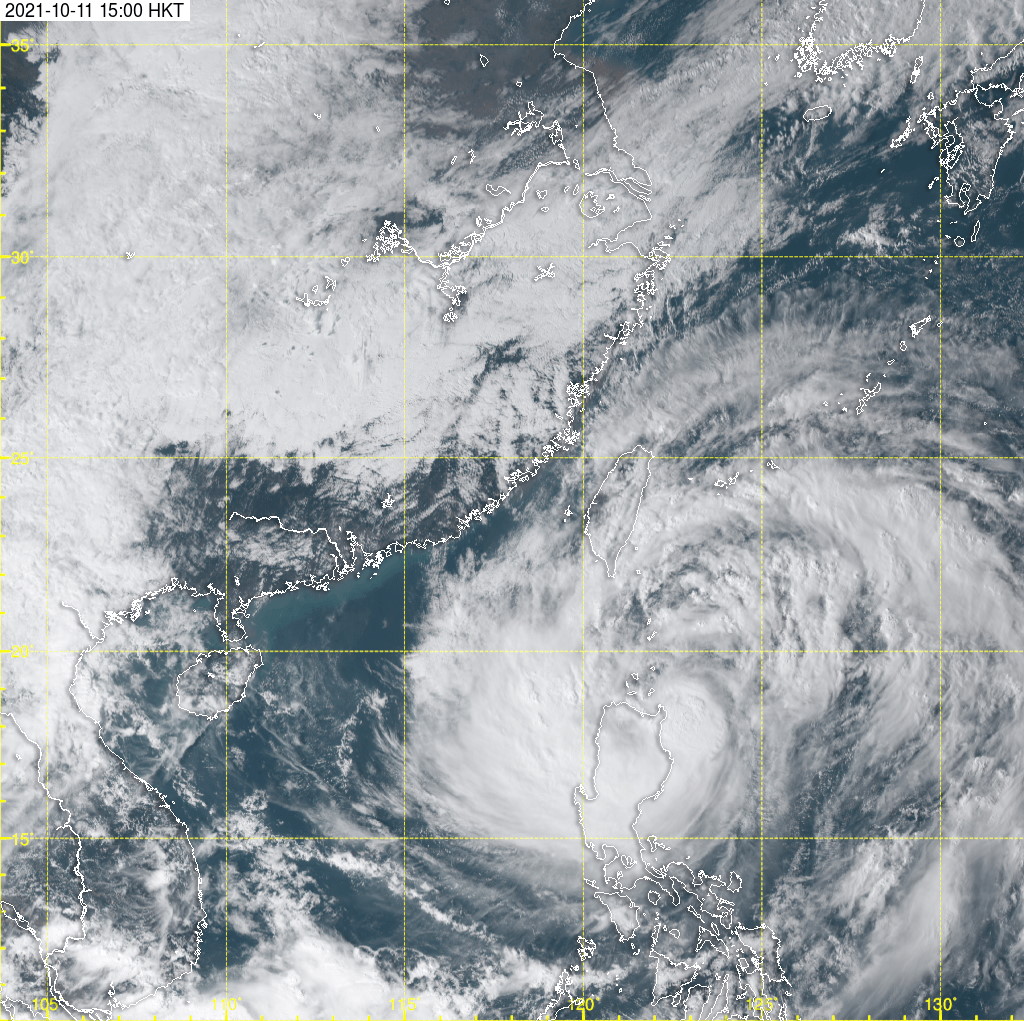
Figure 6 - Satellite image of KOMPASU as it approached northeastern Luzon
圖 6 - 圓規靠近呂宋東北部時之衛星雲圖


Figure 7 - Wind field analysis at 8:24 pm October 12 (left) and 8:54 am October 13 (right)
圖 7 - 10 月 12 日下午 8 時 24 分 (左) 及 13 日上午 8 時 54 分 (右) 之風場掃描
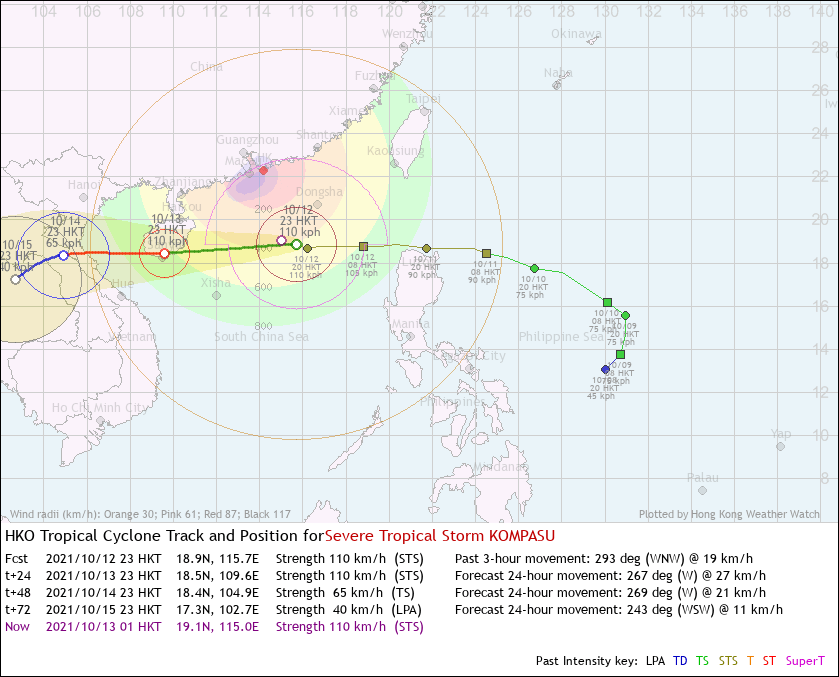
Figure 8 - HKO's forecast track at 11 pm October 12. The estimated radii of 2-metre waves and gale force winds were 540 NM (1,000 km) and 240 NM (444 km), respectively.
圖 8 - 10 月 12 日下午 11 時香港天文台的預測路徑圖,其中估計兩米浪高圈及烈風圈半徑分別為 540 海里 (1,000 公里) 及 240 海里 (444 公里)
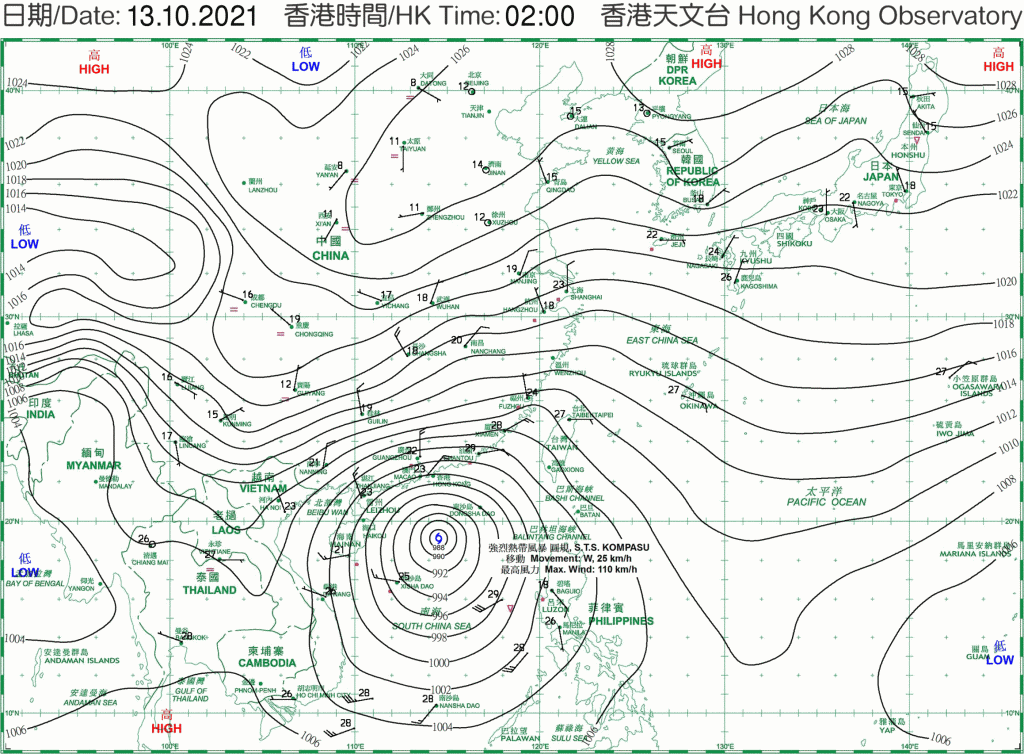
Figure 9 - Surface weather chart at 2 am October 13; note the steep pressure gradient in southern China
圖 9 - 10 月 13 日上午 2 時之地面天氣圖,留意華南氣壓梯度較大

Figure 10 - Values of Δp(972) and Δp(S) between October 5 and 15. Both values were above 15 hPa early on October 13. Higher values indicate a larger pressure difference between Hong Kong and mainland China (Chenzhou for Δp(972) and Shanghai for Δp(S)).
圖 10 - 10 月 5 至 15 日間的 Δp(972) and Δp(S) 數值,兩者於 13 日早段均高於 15 百帕;較高數值表示香港與中國大陸 (Δp(972) 為郴州,Δp(S) 為上海) 的氣壓差距較大

Figure 11 - Satellite image of KOMPASU near its peak intensity
圖 11 - 圓規接近巔峰強度時之衛星雲圖
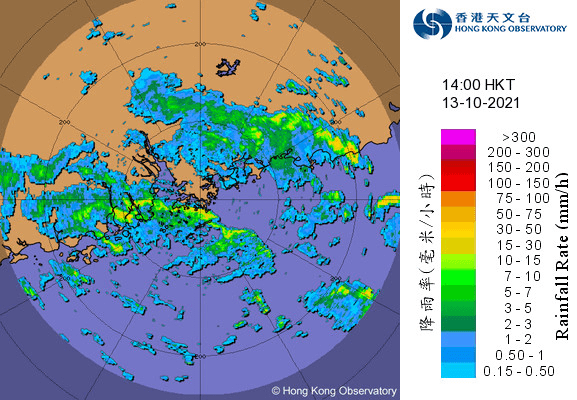
Figure 12 - Radar image showing a rainband approaching Hong Kong in the afternoon of October 13
圖 12 - 10 月 13 日下午之雷達圖顯示一道雨帶正靠近香港

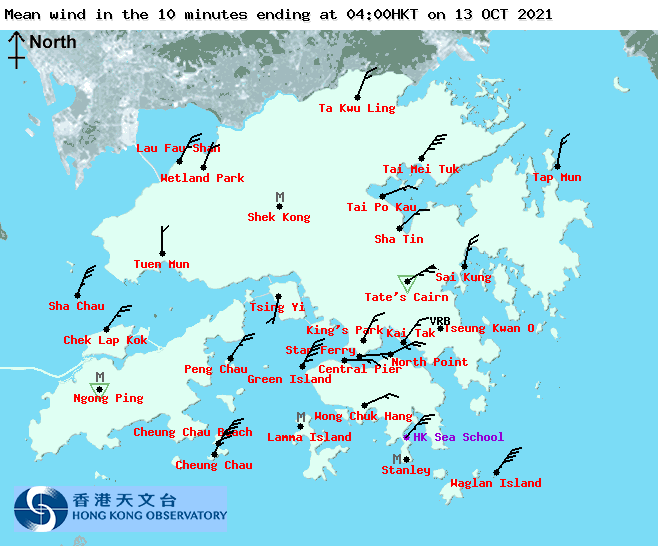


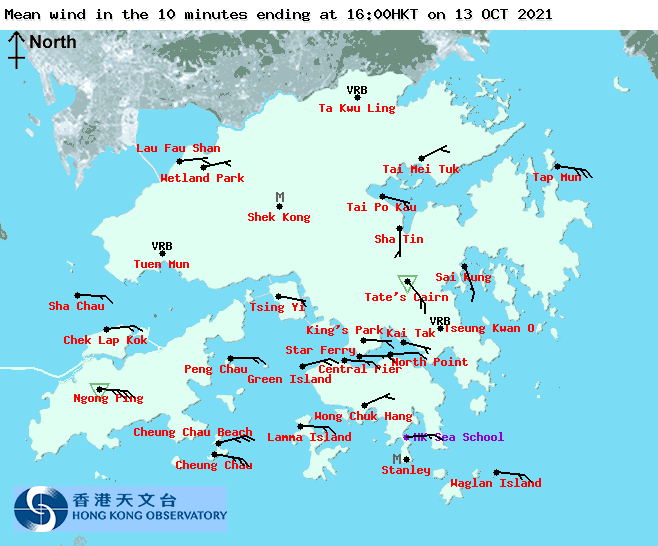

Figure 13 - Local wind distribution maps at 4-hour intervals from midnight to 8 pm October 13
圖 13 - 10 月 13 日午夜至下午 8 時每 4 小時之本港風勢分布圖


Figure 14 - Wind speed time series at Cheung Chau, Green Island, North Point and Tate's Cairn (top to bottom) for October 12 and 13
圖 14 - 長洲、青洲、北角及大老山 (上至下) 於 10 月 12 及 13 日之風速時間序列圖


Figure 15 - Time series of observed versus predicted tide at Quarry Bay (left) and Tai O (right) on October 12 and 13
圖 15 - 鰂魚涌 (左) 及大澳 (右) 於 10 月 12 及 13 日之實測及預測潮汐時間序列圖

Figure 16 - Flooding in Sha Tin near the Shing Mun River in the small hours of October 13 HK Incident Facebook group)
圖 16 - 10 月 13 日凌晨沙田近城門河一帶出現水浸 (取自香港突發事故報料區 Facebook 群組)
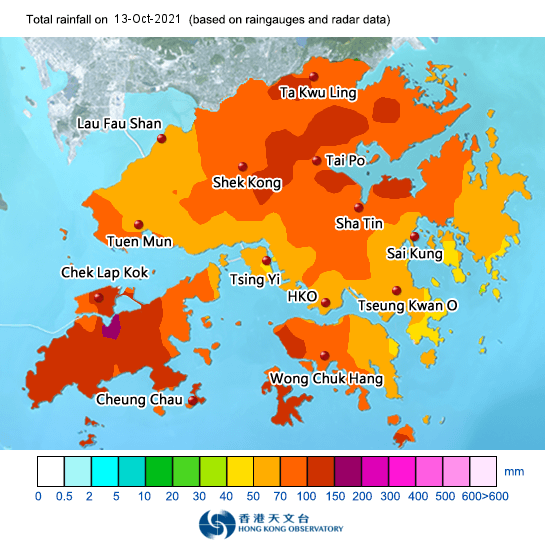
Figure 17 - Rainfall distribution map for October 13
圖 17 - 10 月 13 日之雨量分佈圖
| Winds Recorded at Reference Stations 參考站所錄得的風速 |
The following table lists the maximum 10-minute average (sustained) wind speed recorded while tropical cyclone signals were in force. In some occasions, it is possible that the strongest winds were not recorded when the highest signal was in force.
下表列出各站於熱帶氣旋警告信號生效時所錄得的最高 10 分鐘平均 (持續) 風速,留意此風速不一定於最高信號生效期間錄得。
| Station 風速站 |
Max. 10-min avg. wind speed 最高十分鐘平均風速 |
Beaufort classification 蒲福氏風級分類 |
| Chek Lap Kok 赤鱲角 | 51 km/h | STRONG 強風 |
| Cheung Chau 長洲 | 76 km/h | GALE 烈風 |
| Kai Tak 啟德 | 40 km/h | Fresh 清勁 |
| Lau Fau Shan 流浮山 | 48 km/h | STRONG 強風 |
| Sai Kung 西貢 | 56 km/h | STRONG 強風 |
| Sha Tin 沙田 | Below "fresh" threshold of 31 km/h 低於「清勁」下限的 31 km/h | |
| Ta Kwu Ling 打鼓嶺 | 37 km/h | Fresh 清勁 |
| Tsing Yi (SHL) 青衣蜆殼油庫 | Below "fresh" threshold of 31 km/h 低於「清勁」下限的 31 km/h | |
| Number of stations recording at least STRONG force (force 6 - 7) winds: | 4 |
| Number of stations recording at least GALE force (force 8 - 9) winds: | 1 |
| Number of stations recording at least STORM force (force 10 - 11) winds: | 0 |
| Number of stations recording HURRICANE force (force 12) winds: | 0 |
| 錄得 強風 (6 - 7 級) 或更高風速的站數: | 4 |
| 錄得 烈風 (8 - 9 級) 或更高風速的站數: | 1 |
| 錄得 暴風 (10 - 11 級) 或更高風速的站數: | 0 |
| 錄得 颶風 (12 級) 風速的站數: | 0 |
| Charts and Figures 各項數據 |
Table 1: Track data from HKWW:
表一 : 香港天氣觀測站之路徑資料
YYMMDDZZ Lat Long Wind |
Table 2: Maximum gust and hourly average wind speed recorded in Hong Kong from HKO:
表二 : 香港天文台公佈的各站最高每小時平均風力和陣風數據 (英文)
Maximum Gust |
Maximum Hourly Mean Wind |
|||||||
|---|---|---|---|---|---|---|---|---|
| Direction |
Speed (km/h) |
Date/Month |
Time |
Direction |
Speed (km/h) |
Date/Month |
Time |
|
| Central Pier | E | 91 | 13/10 | 10:24 | E | 53 | 13/10 | 10:00 |
| Cheung Chau | SE | 103 | 13/10 | 10:41 | NNE | 65 | 13/10 | 04:00 |
| Cheung Chau Beach | NE | 119 | 13/10 | 07:31 | ENE | 76 | 13/10 | 10:00 |
| Green Island | NNE | 125 | 13/10 | 03:35 | NNE | 78 | 13/10 | 04:00 |
| Hong Kong International Airport | E | 75 | 13/10 | 10:59 | E | 44 | 13/10 | 12:00 |
| E | 75 | 13/10 | 11:00 | |||||
| Kai Tak | ENE | 80 | 13/10 | 10:22 | E | 33 | 13/10 | 11:00 |
| King's Park | ENE | 79 | 13/10 | 09:12 | E | 35 | 13/10 | 11:00 |
| Lamma Island | ENE | 89 | 13/10 | 07:16 | NNW | 48 | 12/10 | 05:00 |
| Lau Fau Shan | NNE | 75 | 13/10 | 03:32 | N | 40 | 12/10 | 16:00 |
| Ngong Ping | ENE | 138 | 13/10 | 10:48 | E | 90 | 13/10 | 11:00 |
| North Point | ENE | 86 | 13/10 | 11:52 | E | 57 | 13/10 | 10:00 |
| Peng Chau | E | 98 | 13/10 | 10:38 | E | 66 | 13/10 | 11:00 |
| Sai Kung | N | 81 | 12/10 | 21:08 | ENE | 50 | 13/10 | 10:00 |
| Sha Chau | N | 95 | 13/10 | 01:10 | N | 64 | 13/10 | 02:00 |
| Sha Lo Wan | E | 71 | 13/10 | 10:39 | E | 36 | 13/10 | 12:00 |
| Sha Tin | E | 70 | 13/10 | 10:15 | NE | 24 | 12/10 | 22:00 |
| Star Ferry (Kowloon) | E | 85 | 13/10 | 10:50 | E | 38 | 13/10 | 13:00 |
| Ta Kwu Ling | NNE | 72 | 12/10 | 22:02 | NNE | 34 | 12/10 | 23:00 |
| Tai Mei Tuk | NNE | 94 | 13/10 | 04:15 | NE | 61 | 13/10 | 05:00 |
| ENE | 61 | 13/10 | 12:00 | |||||
| Tai Mo Shan | ESE | 119 | 13/10 | 10:03 | E | 80 | 13/10 | 05:00 |
| Tai Po Kau | E | 79 | 13/10 | 11:37 | E | 48 | 13/10 | 12:00 |
| Tap Mun East | E | 108 | 13/10 | 11:23 | E | 71 | 13/10 | 11:00 |
| Tate's Cairn | NE | 153 | 13/10 | 04:28 | ENE | 111 | 13/10 | 05:00 |
| Tseung Kwan O | NNW | 67 | 12/10 | 07:02 | N | 27 | 12/10 | 08:00 |
| Tsing Yi Shell Oil Depot | E | 64 | 13/10 | 05:34 | NNW | 25 | 12/10 | 13:00 |
| Tuen Mun Government Offices | NNE | 55 | 12/10 | 23:08 | N | 21 | 13/10 | 00:00 |
| NNE | 55 | 12/10 | 23:13 | |||||
| Waglan Island | NE | 110 | 13/10 | 04:37 | NE | 85 | 13/10 | 06:00 |
| Wetland Park | NNE | 48 | 13/10 | 04:01 | NNE | 17 | 13/10 | 04:00 |
| Wong Chuk Hang | E | 89 | 13/10 | 07:15 | NE | 32 | 13/10 | 09:00 |
| NE | 32 | 13/10 | 10:00 | |||||
Table 3: Rainfall (in millimetres) contributed by KOMPASU from HKO (figures in brackets are based on incomplete hourly data):
表三 : 香港天文台公佈的各站雨量資料 (英文) (方括號內之數據由不完整之每小時資料擷取)
| 12-Oct |
13-Oct |
14-Oct |
Total Rainfall (mm) |
||
|---|---|---|---|---|---|
| Hong Kong Observatory (HKO) | 0.2 |
57.7 |
13.3 |
71.2 |
|
| Hong Kong International Airport (HKA) | Trace |
102.3 |
11.1 |
113.4 |
|
| Cheung Chau (CCH) | 0.0 |
90.5 |
2.0 |
92.5 |
|
| H23 | Aberdeen | 0.5 |
86.5 |
12.5 |
99.5 |
| N05 | Fanling | 0.0 |
94.0 |
5.0 |
99.0 |
| N13 | High Island | 1.0 |
68.5 |
11.5 |
81.0 |
| K04 | Jordan Valley | 0.5 |
70.0 |
14.0 |
84.5 |
| N06 | Kwai Chung | 0.0 |
77.5 |
25.5 |
103.0 |
| H12 | Mid Levels | 0.0 |
73.5 |
10.0 |
83.5 |
| N09 | Sha Tin | 0.0 |
97.5 |
12.5 |
110.0 |
| H19 | Shau Kei Wan | 0.5 |
67.5 |
9.5 |
77.5 |
| SEK | Shek Kong | 0.0 |
96.0 |
19.5 |
115.5 |
| K06 | So Uk Estate | 0.0 |
79.0 |
13.5 |
92.5 |
| R31 | Tai Mei Tuk | 0.0 |
89.5 |
13.5 |
103.0 |
| N17 | Tung Chung | 0.0 |
160.0 |
7.0 |
167.0 |
| TMR | Tuen Mun Reservoir | 0.3 |
69.4 |
8.5 |
78.2 |
Last Accessed 最近訪問日期: Mon Apr 29 2024 08:45:26 HKT
Last Modified 最近修訂日期: Tue Sep 26 2023
