
TC Watch / 熱帶氣旋 > Selected TC Review / 重要熱帶氣旋回顧 > 202128W (RAI 雷伊) [Refresh 更新]
 202128W (RAI 雷伊) - Profile 檔案 202128W (RAI 雷伊) - Profile 檔案 |
(First draft issued on January 11, 2022, final version issued on March 15, 2022)
(初稿於 2022 年 1 月 11 日發出,最後版本於 2022 年 3 月 15 日上載)
Brief profile of RAI | 雷伊小檔案:
| JTWC number 聯合颱風警報中心 (JTWC) 號碼 | 28W |
| International number 國際編號 | 2122 |
| Period of existence 生存時期^ | 2021/12/12 20 HKT - 2021/12/21 11 HKT |
| Maximum 1-minute wind (JTWC) JTWC 一分鐘平均最高中心風速 | 145 knots 節 (Category 5 Super Typhoon 五級超級颱風) |
| Minimum pressure (JTWC) JTWC 最低氣壓 | 915 hPa 百帕 |
| Highest TC signal by HKO 香港天文台發出最高熱帶氣旋警告信號 |
1 (Standby Signal 戒備信號) |
| Closest point of approach by HKO 香港天文台所示之最接近距離 |
S 140 km (real-time warning 實時報告) / SSE 140 km (TC report 熱帶氣旋報告) |
| Time of closest approach by HKO 香港天文台所示之最接近時間 |
2021/12/21 11 HKT (real-time warning 實時報告 / TC report 熱帶氣旋報告) |
| Lowest pressure recorded at HKO 香港天文台錄得的最低氣壓 |
1011.9 hPa 百帕 (2021/12/21 05:31 HKT) |
^Refers to the period between the HK Observatory's first and last bulletins for the tropical cyclone (with at least tropical depression intensity). For storms formed/dissipated/transformed into an extratropical cyclone outside the area bounded by 7-36°N and 100-140°E, information from the JTWC will be used instead.
^即香港天文台為該熱帶氣旋 (熱帶低氣壓級或更高) 作出發佈的時期。至於在北緯 7 至 36 度、東經 100 至 140 度外形成/消散/轉化為溫帶氣旋的風暴,本網將參考聯合颱風警報中心的資料。
TC signals in Hong Kong* 香港曾經生效的熱帶氣旋警告*:
| Signal 信號 |
Date and time 日期和時間 |
Distance from HK 與香港的距離 |
Predicted movement 預測移動趨勢 |
Max. 10-min winds 中心最高十分鐘平均風速 |
 |
2021/12/20 (MON) 11:20 HKT | SSW 640 km | NNE at 22 km/h | 110 km/h (60 knots, STS) |
 |
2021/12/21 (TUE) 12:20 HKT | SSE 150 km | ENE at 25 km/h | 55 km/h (30 knots, TD) |
*Based on the information from real-time tropical cyclone warning bulletins.
*根據實時熱帶氣旋警報資料。
IR imagery animation 紅外線雲圖動畫:
TC track from HKWW 本站的熱帶氣旋路徑圖:
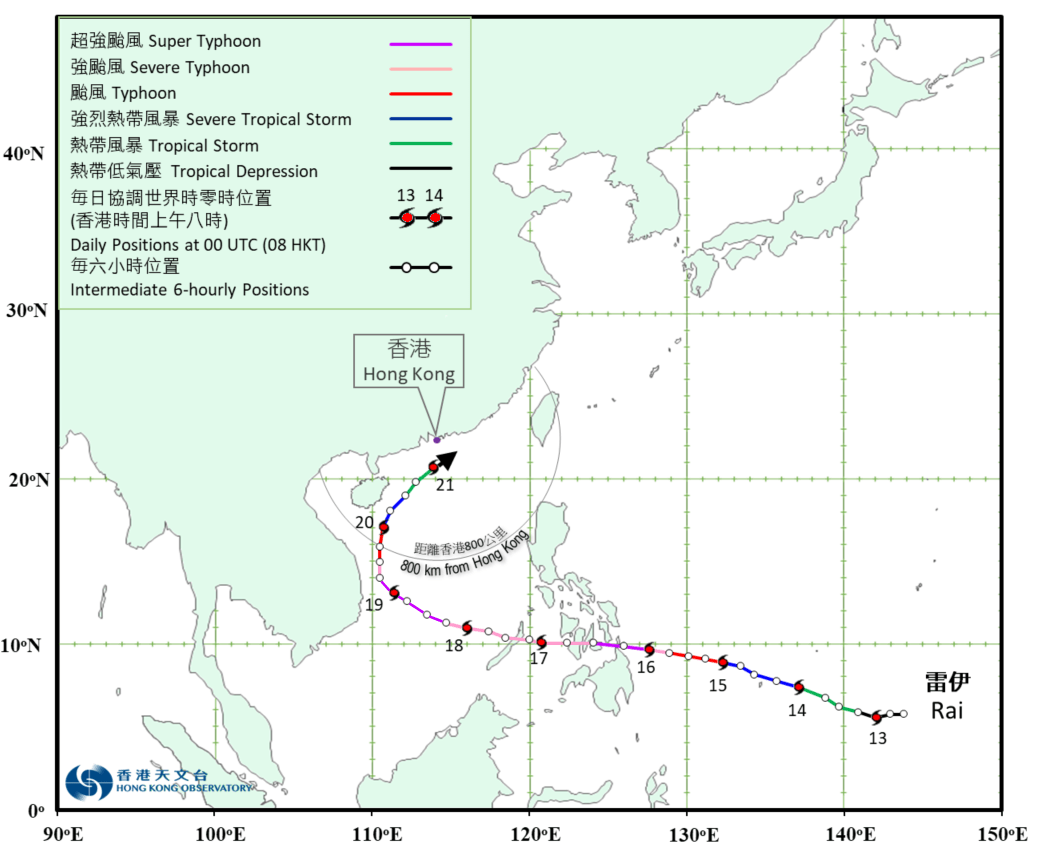
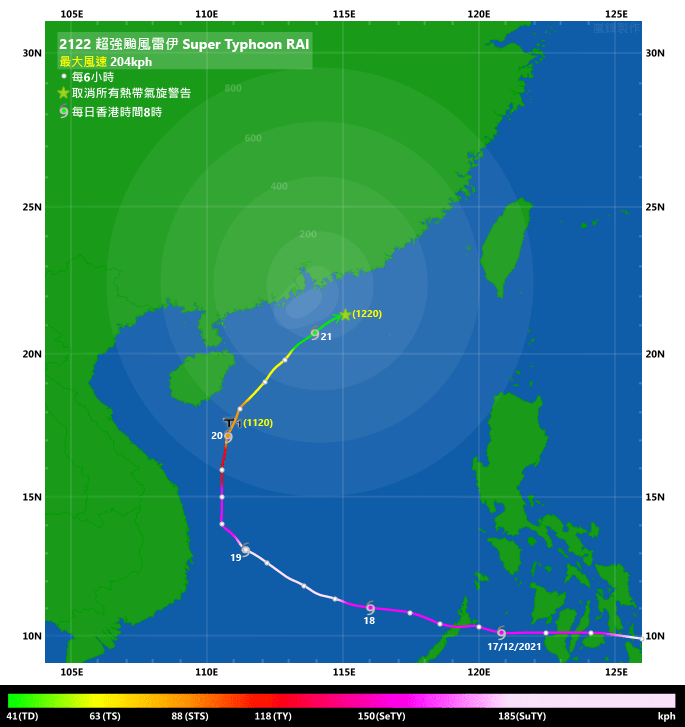
TC track from HKO 天文台的熱帶氣旋路徑圖:
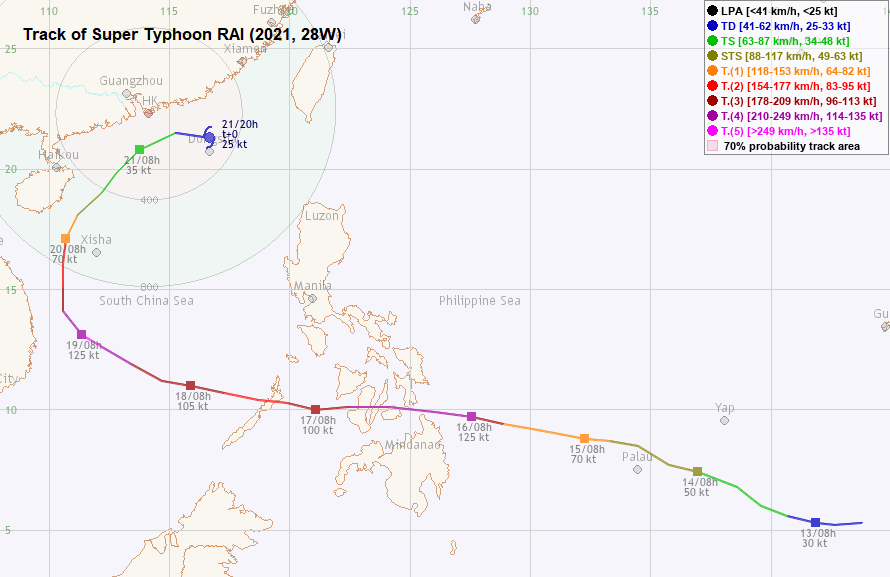
TC track with signal information 附有熱帶氣旋警告信號資料的路徑圖:
(Track figure courtesy of Lorenzo. Data from HKO. 鳴謝 Lorenzo 提供路徑圖,資料取自天文台)
| Past HKWW Bulletins 本站發佈 |
Please click here for bulletins on this tropical cyclone. 請按這裡。
| Storm Development Overview 風暴發展概覽 |
Unless otherwise stated, all times below are in Hong Kong Standard Time (UTC+8)
除非特別註明,下文時間均為香港標準時間 (協調世界時加 8 小時)
Tropical disturbance 96W developed in the northwest Pacific southeast of Yap in mid-December. On December 12, convective bursts could be seen forming near its centre as the disturbance's spiraling characteristics became apparent. The JTWC issued a tropical cyclone formation alert that morning, while the JMA issued a gale warning.
The HKO upgraded 96W into a tropical depression at 8 pm December 12. On the other hand, the JTWC upgraded the system at 8 am December 13, assigning to it the storm number 28W. 28W was expected to move west-northwest turning to west towards the Philippines, and would strengthen gradually over the next few days. Numerical models started to suggest a weakening of the subtropical ridge as 28W moved into the South China Sea, leading to a recurvature scenario.
28W was upgraded into a tropical storm by the JMA at 2 pm December 13, and was named RAI. The storm benefited from high sea temperatures and decent upper-level divergence. As a result, it intensified steadily into a severe tropical storm on December 14 and further into a typhoon on December 15. The subtropical ridge extended westwards as RAI turned more westwards at that time.
Starting from the afternoon of December 15, RAI experienced a period of rapid intensification. The storm's central dense overcast deepened and expanded in size overnight, coupled with the development of a pinhole eye. The JTWC's estimated intensity was adjusted upwards from 80 knots (148 km/h) at 8 pm December 15 to 140 knots (259 km/h) at 8 am December 16. However, its category 5 strength was short-lived as the storm made landfall in the Philippine province of Surigao del Norte near 1:30 pm. RAI's eye collapsed shortly after landfall. The storm crossed several islands in central Philippines during the rest of December 16 and in the morning of December 17. A gradual deterioration of RAI's structure could be seen from satellite images, but the storm managed to emerge into the South China Sea as a severe typhoon (based on HKO's classification). Both the HKO and JTWC's estimated intensities were 90 knots (167 km/h) in the night of December 17.
As RAI made landfall in the Philippines near its peak strength, the storm inflicted severe damage and casualties along its track. More than 400 lives were lost and the economic damage was estimated to be about 800 million US dollars. This made RAI the third costliest typhoon in the Philippines after super typhoons Haiyan in 2013 and Bopha in 2012 (see Wikipedia page on RAI).
RAI continued to move west-northwest in the South China Sea. It started to intensify again in the afternoon of December 18. A central dense overcast comparable in appearance to the one before its initial landfall developed, as well as a round eye bigger in size than last time. This prompted the JTWC to upgrade the storm into a category 5-equivalent super typhoon again, with an estimated intensity of 145 knots (269 km/h). The HKO also assessed RAI to reach a peak intensity of 110 knots (204 km/h), and mentioned that RAI was the first super typhoon (HKO classification) to develop in the month of December in the South China Sea since 1961.
The subtropical ridge weakened gradually as RAI approached the western part of the South China Sea. Just as numerical models predicted, RAI turned north before reaching the Vietnamese coast. Subject to much cooler sea temperatures, RAI's structure collapsed and its eye disappeared in the morning of December 19. Still, RAI was intense and close enough to Hainan Island that a yellow typhoon alert was issued, signifying the possibility of gale force winds.
RAI's deep convections vapourized on December 20 as the storm turned northeast. The HKO downgraded RAI into a tropical depression in the early morning of December 21 and further into a low pressure area in the afternoon. The storm was as north as 21.5°N at that time.
熱帶擾動 96W 於 12 月中旬在雅蒲島東南方的西北太平洋發展。至 12 日,該擾動的螺旋性漸趨明顯,近中心有對流爆發,聯合颱風警報中心於早上發出熱帶氣旋形成警報,而日本氣象廳則發佈烈風警告。
香港天文台於 12 月 12 日下午 8 時將 96W 升格為熱帶低氣壓。另一邊廂,聯合颱風警報中心於 13 日上午 8 時作出升格,並給予風暴編號 28W,當時預料 28W 將於未來數天向西北偏西轉西移動,趨向菲律賓一帶,並逐漸增強。數值模式顯示風暴進入南海後副熱帶高壓脊將減弱,風暴繼而轉向。
日本氣象廳於 12 月 13 日下午 2 時將 28W 升格為熱帶風暴,並命名為雷伊。受惠於高海溫及良好高空輻散,雷伊於 14 日增強為強烈熱帶風暴,並於 15 日進一步增強為颱風。此時,副熱帶高壓脊有所西伸,雷伊的路徑漸轉偏西。
自 12 月 15 日下午起,雷伊出現一輪急速增強,晚間其中心密集雲區擴大並變得深厚,更發展出一針眼。聯合颱風警報中心對其估計風速由 15 日下午 8 時的 80 節 (每小時 148 公里) 上調至 16 日上午 8 時的 140 節 (每小時 259 公里)。可是,風暴只短暫維持五級強度,就於下午約 1 時 30 分登陸菲律賓北蘇里高省。雷伊的風眼於登陸後不久崩潰,風暴於 16 日餘下時間及 17 日早段橫過菲律賓中部數個島嶼。從衛星雲圖上可見雷伊的結構逐漸轉差,但它仍以強颱風強度 (香港天文台分級) 進入南海。聯合颱風警報中心及香港天文台於 17 日晚均估計雷伊的強度達 90 節 (每小時 167 公里)。
由於雷伊以接近巔峰強度登陸菲律賓,它沿途造成嚴重破壞及人命傷亡。當地超過 400 人喪生,而經濟損失估計接近 8 億美元,金額僅次於 2013 年的超級颱風海燕及 2012 年的寶霞 (見維基百科上有關雷伊的頁面 (英文版))。
雷伊於南海繼續向西北偏西移動,並於 12 月 18 日下午開始再度增強。風暴發展出與初次登陸前外觀相若的中心密集雲區,而風眼亦較上次大及渾圓。聯合颱風警報中心再次將雷伊升格為相當於五級強度的超級颱風,估計風力達 145 節 (每小時 269 公里)。香港天文台亦評估雷伊的巔峰強度為 110 節 (每小時 204 公里),並提及雷伊是自 1961 年以來南海首度於 12 月出現超強颱風 (香港天文台分級)。
隨著雷伊移至南海西部,副熱帶高壓脊逐漸減弱。一如數值模式預計,雷伊於到達越南沿岸前轉向。受到顯著較涼的海溫影響,雷伊的結構崩潰,其風眼於 12 月 19 日早上消失。雖然如此,雷伊逐漸靠近海南島,其強度仍然足以令該地發佈颱風黃色預警,表示有機會吹烈風。
雷伊於 12 月 20 日轉向東北移動,其深層對流逐漸蒸發,香港天文台於 21 日早上初段降格雷伊為熱帶低氣壓,並於下午表示風暴已減弱為低壓區,當時它已到達北緯 21.5 度。
| Weather in Hong Kong During Approach 風暴影響時香港天氣狀況 |
Link to relevant HKO weather report bulletins:
20/12 ●
21/12
香港天文台相關天氣報告連結:20/12 ●
21/12
RAI was the latest tropical cyclone to affect Hong Kong in a calendar year since records began, and it was only the second time that a tropical cyclone warning signal was issued in the month of December, after IRMA in 1974. Because of the potential for RAI to recurve and reach the northern South China Sea, the development of this storm attracted media attention even before it made landfall in the Philippines. The HK Observatory was forecasting rainy weather to affect the Guangdong coastal areas as RAI moved closer to the region. In the early afternoon of December 19, the Observatory mentioned that it would consider the need for a tropical cyclone warning signal during the day of December 20.
The #1 Standby Signal was issued at 11:20 am December 20. By that time, RAI had already weakened into a severe tropical storm, and was around 640 km from Hong Kong. It was forecast that winds would occasionally reach strong force in offshore waters and on high ground that night and in the early parts of the next day.
While the Observatory mentioned the possibility of issuing the #3 Strong Wind Signal if there were signs that local winds would strengthen, RAI's rapid rate of weakening meant that winds remained rather stable during the day. As northerly winds prevailed, some stations such as Kowloon Star Ferry Pier and Tap Mun actually saw a declining wind speed.
The rainfall in Hong Kong due to RAI became more persistent in the late afternoon of December 20, although it remained rather light. As the rain stopped and winds remained relatively mild in the small hours of December 21, it was evident that RAI's impact to the territory would be limited. At 5 am, the Observatory mentioned that the chance of issuing a higher signal was not high.
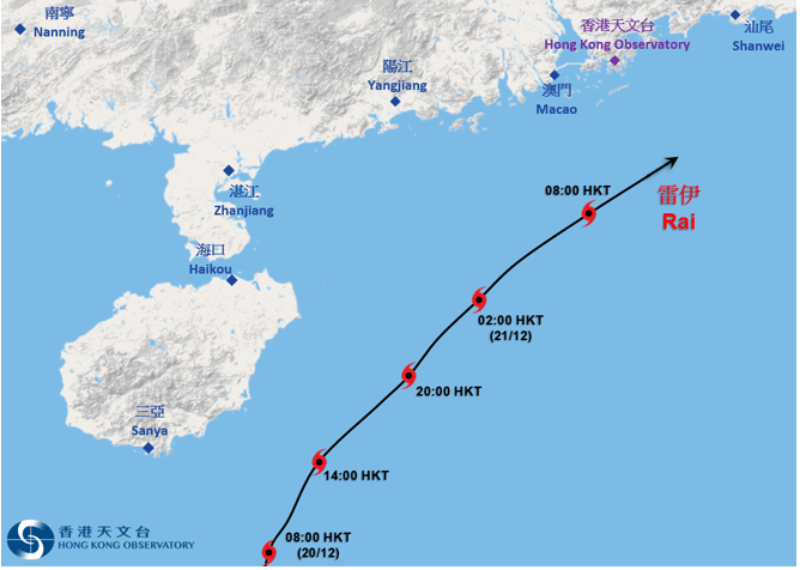
RAI made its closest point of approach to Hong Kong at around 11 am December 21, when it was located 140 km to the south-southeast. The #1 Signal was cancelled shortly afterwards, at 12:20 pm.
雷伊是有紀錄以來一年中最遲影響香港的熱帶氣旋,亦是自 1974 年氣旋艾瑪以來再次於 12 月發出熱帶氣旋警告。由於預測雷伊有機會轉向並進入南海北部,風暴登陸菲律賓前已有傳媒提及。香港天文台預計雷伊靠近廣東沿岸時會有雨。12 月 19 日下午初段,天文台表示將於 20 日的日間考慮是否需要發出熱帶氣旋警告。
一號戒備信號於 12 月 20 日上午 11 時 20 分發出,當時雷伊已減弱為強烈熱帶風暴,距離香港約 640 公里,預測當晚及翌日早段離岸及高地間中吹強風。
雖然天文台其後提及若本地風勢有跡象增強將考慮改發三號強風信號,但隨著雷伊迅速減弱,本港當天風勢大致維持穩定。由於普遍吹偏北風,部分氣象站如九龍天星碼頭及塔門風勢反而有所減弱。
至 12 月 20 日下午較後時間,與雷伊相關的雨帶開始影響本港,降雨較為持續但雨勢較弱。21 日凌晨降雨停止,風勢仍然較為緩和,可以肯定雷伊對香港的影響有限。天文台於上午 5 時表示改發更高信號機會不大。
雷伊於 12 月 21 日上午約 11 時最接近香港,風暴集結於本港東南偏南約 140 公里。一號信號在不久後的下午 12 時 20 分取消。
| Image Gallery 圖片庫 |

Figure 1 - Satellite image of RAI at its formation
圖 1 - 雷伊形成初時之衛星雲圖


Figure 2 - GFS (left) and ECMWF (right) ensemble forecasts for RAI at 8 am December 14
圖 2 - 12 月 14 日上午 8 時之 GFS (左) 及 ECMWF (右) 模式集成預報圖


Figure 3 - Forecast tracks from various official agencies on December 13 (left) and 19 (right)
圖 3 - 12 月 13 (左) 及 19 日 (右) 各官方氣象台之預測路徑

Figure 4 - Satellite image of RAI several hours before its landfall in the Philippines
圖 4 - 雷伊於登陸菲律賓前數小時之衛星雲圖


Figure 5 - JTWC forecast tracks at 8 am December 16 (top) and 2 am December 19 (bottom)
圖 5 - 12 月 16 日上午 8 時 (上) 及 19 日上午 2 時 (下) 聯合颱風警報中心之預測路徑圖

Figure 6 - RAI at its peak intensity in the South China Sea
圖 6 - 雷伊於南海到達顛峰強度時之衛星雲圖

Figure 7 - HKO's forecast track at 2 am December 19
圖 7 - 12 月 19 日上午 2 時香港天文台之預測路徑圖

Figure 8 - HKO's tropical cyclone track probability forecast chart on December 19, indicating a moderate chance for RAI to be quite close to Hong Kong
圖 8 - 12 月 19 日香港天文台之熱帶氣旋路徑概率預報圖,顯示雷伊有中等機會頗為接近香港

Figure 9 - 500-hPa upper-level weather map at 8 am December 19
圖 9 - 12 月 19 日上午 8 時之 500 百帕高空天氣圖


Figure 10 - Steering flow (top) and vertical wind shear (bottom) charts at 8 am December 20. Note the relatively mild shear in northern South China Sea.
圖 10 - 12 月 20 日之駛流場 (上) 及垂直風切變 (下) 分佈圖,留意南海北部垂直風切變水平仍相對較低

Figure 11 - Satellite image of RAI as it disintegrated gradually off the seas of Hainan Island
圖 11 - 雷伊於海南島對開海域逐漸解體時之衛星雲圖

Figure 12 - Radar image at 6:36 pm December 20
圖 12 - 12 月 20 日下午 6 時 36 分之雷達圖

Figure 13 - Wind field analysis map at 9:43 am December 21, showing a complete low-level circulation centre and winds nearing gale force (34 knots) in the vicinity of Hong Kong
圖 13 - 12 月 21 日上午 9 時 43 分之風場掃描圖,顯示一完整低層環流中心,香港附近風勢接近烈風 (34 節) 水平


Figure 14 - Wind speed time series at Cheung Chau (top) and Waglan Island (bottom) on December 20 and 21
圖 14 - 長洲 (上) 及橫瀾島 (下) 於 12 月 20 及 21 日之風速時間序列圖
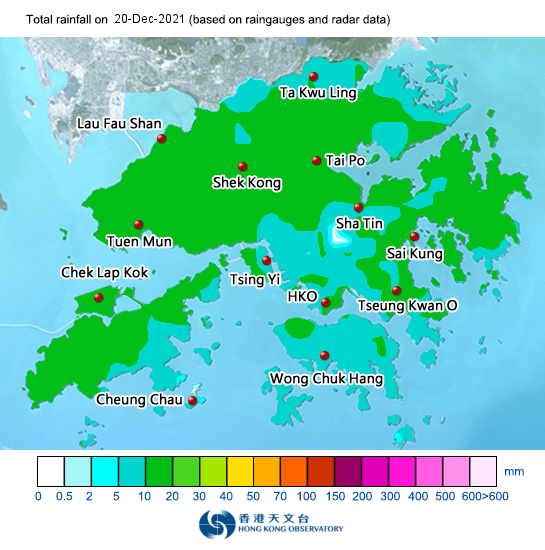
Figure 15 - Rainfall distribution map for December 20
圖 15 - 12 月 20 日之雨量分佈圖

Figure 16 - Screenshot of HKO's webpage showing the presence of the #1 Standby Signal on the day of winter solstice (in Chinese)
圖 16 - 香港天文台的網頁截圖,顯示一號戒備信號於冬至日生效
| Winds Recorded at Reference Stations 參考站所錄得的風速 |
The following table lists the maximum 10-minute average (sustained) wind speed recorded while tropical cyclone signals were in force. In some occasions, it is possible that the strongest winds were not recorded when the highest signal was in force.
下表列出各站於熱帶氣旋警告信號生效時所錄得的最高 10 分鐘平均 (持續) 風速,留意此風速不一定於最高信號生效期間錄得。
| Station 風速站 |
Max. 10-min avg. wind speed 最高十分鐘平均風速 |
Beaufort classification 蒲福氏風級分類 |
| Chek Lap Kok 赤鱲角 | Below "fresh" threshold of 31 km/h 低於「清勁」下限的 31 km/h | |
| Cheung Chau 長洲 | 43 km/h | STRONG 強風 |
| Kai Tak 啟德 | Below "fresh" threshold of 31 km/h 低於「清勁」下限的 31 km/h | |
| Lau Fau Shan 流浮山 | Below "fresh" threshold of 31 km/h 低於「清勁」下限的 31 km/h | |
| Sai Kung 西貢 | Below "fresh" threshold of 31 km/h 低於「清勁」下限的 31 km/h | |
| Sha Tin 沙田 | Below "fresh" threshold of 31 km/h 低於「清勁」下限的 31 km/h | |
| Ta Kwu Ling 打鼓嶺 | Below "fresh" threshold of 31 km/h 低於「清勁」下限的 31 km/h | |
| Tsing Yi (SHL) 青衣蜆殼油庫 | Below "fresh" threshold of 31 km/h 低於「清勁」下限的 31 km/h | |
| Number of stations recording at least STRONG force (force 6 - 7) winds: | 1 |
| Number of stations recording at least GALE force (force 8 - 9) winds: | 0 |
| Number of stations recording at least STORM force (force 10 - 11) winds: | 0 |
| Number of stations recording HURRICANE force (force 12) winds: | 0 |
| 錄得 強風 (6 - 7 級) 或更高風速的站數: | 1 |
| 錄得 烈風 (8 - 9 級) 或更高風速的站數: | 0 |
| 錄得 暴風 (10 - 11 級) 或更高風速的站數: | 0 |
| 錄得 颶風 (12 級) 風速的站數: | 0 |
| Charts and Figures 各項數據 |
Table 1: Track data from HKWW:
表一 : 香港天氣觀測站之路徑資料
YYMMDDZZ Lat Long Wind |
Table 2: Maximum gust and hourly average wind speed recorded in Hong Kong from HKO:
表二 : 香港天文台公佈的各站最高每小時平均風力和陣風數據 (英文)
Maximum Gust |
Maximum Hourly Mean Wind |
|||||||
|---|---|---|---|---|---|---|---|---|
| Direction |
Speed (km/h) |
Date/Month |
Time |
Direction |
Speed (km/h) |
Date/Month |
Time |
|
| Central Pier | E | 34 | 20/12 | 17:05 | ESE | 18 | 20/12 | 15:00 |
| Cheung Chau | NNW | 65 | 21/12 | 12:16 | N | 38 | 21/12 | 12:00 |
| Cheung Chau Beach | NE | 60 | 21/12 | 11:47 | NNE | 33 | 21/12 | 02:00 |
| Green Island | NE | 57 | 21/12 | 01:28 | ENE | 40 | 21/12 | 02:00 |
| Hong Kong International Airport | NE | 33 | 20/12 | 13:17 | NE | 21 | 21/12 | 01:00 |
| Kai Tak | ENE | 39 | 20/12 | 14:31 | WNW | 14 | 21/12 | 11:00 |
| King's Park | E | 41 | 20/12 | 20:44 | E | 17 | 20/12 | 22:00 |
| Lamma Island | NW | 48 | 21/12 | 12:16 | NW | 34 | 21/12 | 12:00 |
| Lau Fau Shan | NNE | 30 | 20/12 | 22:05 | E | 19 | 20/12 | 12:00 |
| Ngong Ping | ENE | 60 | 20/12 | 19:40 | ENE | 46 | 20/12 | 20:00 |
| ENE | 60 | 20/12 | 19:41 | |||||
| North Point | E | 41 | 21/12 | 01:04 | E | 24 | 21/12 | 01:00 |
| Peng Chau | NNW | 52 | 21/12 | 11:53 | NNW | 35 | 21/12 | 12:00 |
| Ping Chau | NE | 30 | 20/12 | 22:18 | NW | 8 | 21/12 | 06:00 |
| NW | 8 | 21/12 | 07:00 | |||||
| Sai Kung | NNE | 48 | 21/12 | 11:23 | N | 22 | 21/12 | 12:00 |
| Sha Chau | N | 45 | 21/12 | 02:35 | N | 35 | 20/12 | 20:00 |
| Sha Lo Wan | ENE | 23 | 20/12 | 20:31 | ENE | 10 | 21/12 | 00:00 |
| NE | 10 | 21/12 | 01:00 | |||||
| Sha Tin | NE | 27 | 20/12 | 14:16 | N | 12 | 20/12 | 21:00 |
| N | 12 | 21/12 | 03:00 | |||||
| Star Ferry (Kowloon) | ESE | 30 | 20/12 | 14:36 | E | 17 | 20/12 | 12:00 |
| Ta Kwu Ling | N | 33 | 21/12 | 09:59 | N | 14 | 21/12 | 11:00 |
| Tai Mei Tuk | NNE | 53 | 21/12 | 01:31 | NNE | 31 | 21/12 | 03:00 |
| NNE | 53 | 21/12 | 02:42 | |||||
| Tai Mo Shan | ESE | 79 | 21/12 | 02:23 | E | 60 | 20/12 | 20:00 |
| Tai Po Kau | W | 30 | 21/12 | 10:11 | W | 19 | 21/12 | 11:00 |
| Tap Mun East | N | 41 | 21/12 | 11:33 | N | 19 | 21/12 | 11:00 |
| Tate's Cairn | NE | 66 | 21/12 | 01:14 | E | 48 | 20/12 | 21:00 |
| Tseung Kwan O | NNE | 34 | 21/12 | 02:32 | ENE | 12 | 21/12 | 10:00 |
| Tsing Yi Shell Oil Depot | NW | 23 | 21/12 | 07:20 | NW | 9 | 21/12 | 05:00 |
| NW | 23 | 21/12 | 07:21 | |||||
| Tuen Mun Government Offices | NNE | 35 | 20/12 | 13:03 | NNE | 17 | 20/12 | 14:00 |
| Waglan Island | NE | 68 | 21/12 | 00:41 | ENE | 57 | 21/12 | 01:00 |
| Wetland Park | ENE | 23 | 20/12 | 11:35 | ENE | 10 | 20/12 | 12:00 |
| Wong Chuk Hang | N | 53 | 20/12 | 22:19 | ENE | 21 | 21/12 | 02:00 |
Table 3: Rainfall (in millimetres) contributed by RAI from HKO (figures in brackets are based on incomplete hourly data):
表三 : 香港天文台公佈的各站雨量資料 (英文) (方括號內之數據由不完整之每小時資料擷取)
| 20-Dec |
21-Dec |
Total Rainfall (mm) |
||
|---|---|---|---|---|
| Hong Kong Observatory (HKO) | 9.4 |
2.4 |
11.8 |
|
| Hong Kong International Airport (HKA) | 15.5 |
12.8 |
28.3 |
|
| Cheung Chau (CCH) | 8.0 |
6.5 |
14.5 |
|
| H23 | Aberdeen | 5.5 |
1.0 |
6.5 |
| N05 | Fanling | 12.5 |
9.0 |
21.5 |
| N13 | High Island | 11.0 |
5.0 |
16.0 |
| K04 | Jordan Valley | 11.0 |
4.5 |
15.5 |
| N06 | Kwai Chung | 8.5 |
1.5 |
10.0 |
| H12 | Mid Levels | 11.5 |
3.5 |
15.0 |
| N09 | Sha Tin | 11.0 |
7.0 |
18.0 |
| H19 | Shau Kei Wan | 10.0 |
4.5 |
14.5 |
| SEK | Shek Kong | 12.5 |
6.5 |
19.0 |
| K06 | So Uk Estate | 11.0 |
1.5 |
12.5 |
| R31 | Tai Mei Tuk | 8.5 |
4.5 |
13.0 |
| R21 | Tap Shek Kok | 12.0 |
16.0 |
28.0 |
| N17 | Tung Chung | 14.5 |
17.5 |
32.0 |
| TMR | Tuen Mun Reservoir | 13.7 |
16.9 |
30.6 |
Last Accessed 最近訪問日期: Tue Apr 30 2024 00:05:39 HKT
Last Modified 最近修訂日期: Tue Sep 26 2023
