
TC Watch / 熱帶氣旋 > Selected TC Review / 重要熱帶氣旋回顧 > 202309W (SAOLA 蘇拉) [Refresh 更新]
 202309W (SAOLA 蘇拉) - Profile 檔案 202309W (SAOLA 蘇拉) - Profile 檔案 |
(First draft issued on September 24, 2023, final version issued on February 11, 2024)
(初稿於 2023 年 9 月 24 日發出,最後版本於 2024 年 2 月 11 日上載)
Brief profile of SAOLA | 蘇拉小檔案:
| JTWC number 聯合颱風警報中心 (JTWC) 號碼 | 09W |
| International number 國際編號 | 2309 |
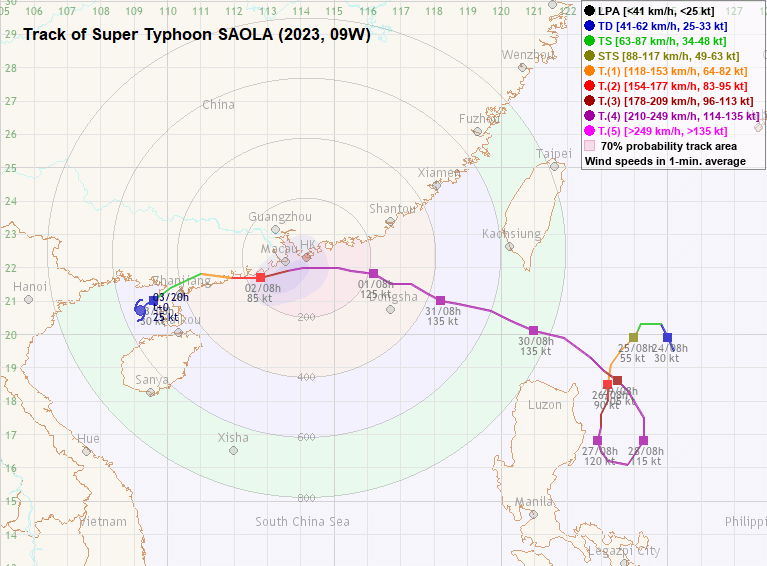
| Period of existence 生存時期^ | 2023/08/24 02 HKT - 2023/09/03 14 HKT |
| Maximum 1-minute wind (JTWC) JTWC 一分鐘平均最高中心風速 | 135 knots 節 (Category 4 Super Typhoon 四級超級颱風) |
| Minimum pressure (JTWC) JTWC 最低氣壓 | 921 hPa 百帕 |
| Highest TC signal by HKO 香港天文台發出最高熱帶氣旋警告信號 |
10 (Hurricane Signal 颶風信號) |
| Closest point of approach by HKO 香港天文台所示之最接近距離 |
SSW 30 km (real-time warning 實時報告) / SSE 40 km (TC report 熱帶氣旋報告) |
| Time of closest approach by HKO 香港天文台所示之最接近時間 |
2023/09/01 23 HKT (real-time warning 實時報告) / 21 HKT (TC report 熱帶氣旋報告) |
| Lowest pressure recorded at HKO 香港天文台錄得的最低氣壓 |
986.7 hPa 百帕 (2023/09/01 21:45 HKT) |
^Refers to the period between the HK Observatory's first and last bulletins for the tropical cyclone (with at least tropical depression intensity). For storms formed/dissipated/transformed into an extratropical cyclone outside the area bounded by 7-36°N and 100-140°E, information from the JTWC will be used instead.
^即香港天文台為該熱帶氣旋 (熱帶低氣壓級或更高) 作出發佈的時期。至於在北緯 7 至 36 度、東經 100 至 140 度外形成/消散/轉化為溫帶氣旋的風暴,本網將參考聯合颱風警報中心的資料。
TC signals in Hong Kong* 香港曾經生效的熱帶氣旋警告*:
| Signal 信號 |
Date and time 日期和時間 |
Distance from HK 與香港的距離 |
Predicted movement 預測移動趨勢 |
Max. 10-min winds 中心最高十分鐘平均風速 |
 |
2023/08/30 (WED) 17:40 HKT | ESE 610 km | WNW at 15 km/h | 230 km/h (125 knots, SuT) |
 |
2023/08/31 (THU) 15:40 HKT | ESE 380 km | WNW at 10 km/h | 205 km/h (110 knots, SuT) |
 |
2023/09/01 (FRI) 02:40 HKT | ESE 280 km | WNW at 10 km/h | 205 km/h (110 knots, SuT) |
 |
2023/09/01 (FRI) 18:20 HKT | ESE 90 km | W/WNW at 12 km/h | 210 km/h (115 knots, SuT) |
 |
2023/09/01 (FRI) 20:15 HKT | SE 60 km | W/WNW at 12 km/h | 210 km/h (115 knots, SuT) |
 |
2023/09/02 (SAT) 03:40 HKT | WSW 100 km | W/WSW at 14 km/h | 165 km/h (90 knots, ST) |
|
2023/09/02 (SAT) 16:20 HKT | WSW 260 km | WSW at 12 km/h | 110 km/h (60 knots, STS) |
|
2023/09/02 (SAT) 20:20 HKT | W 320 km | W/WSW at 12 km/h | 75 km/h (40 knots, TS) |
 |
2023/09/02 (SAT) 23:40 HKT | WSW 380 km | WSW at 12 km/h | 65 km/h (35 knots, TS) |
*Based on the information from real-time tropical cyclone warning bulletins.
*根據實時熱帶氣旋警報資料。
Percentile rank among all storms necessitating at least the #3 Strong Wind Signal from 1986 to 2023 (at compilation of this review)*: *This measures the relative wind strength in Hong Kong caused by this storm compared with others. 指標顯示此風暴相對於其他氣旋為香港帶來之風力強度 For more information, please refer to Wind Speed Data for TCs that Have Affected Hong Kong. 更多資訊載於 影響香港氣旋之風速數據 頁 |
Overall: 總計: |
|
Strong 強 |
|||
| Component Ranks 分部等級 | ||||||
| Reference stations: 參考站: |
|
Strong 強 |
||||
| Victoria Harbour: 維多利亞港: |
|
Strong 強 |
||||
| Urban: 市區: |
|
Strong 強 |
||||
| Offshore & high ground 離岸和高地: |
|
Strong 強 |
||||
Cyclones that attained similar rating: HATO (2017), VICENTE (2012), YORK (1999) 相近級別之熱帶氣旋:天鴿 (2017)、韋森特 (2012)、約克 (1999) |
||||||
IR imagery animation 紅外線雲圖動畫:
Radar animations 雷達圖動畫:
256-km range 256 公里範圍
128-km range 128 公里範圍
TC track from HKWW 本站的熱帶氣旋路徑圖:
TC track(s) from HKO 天文台的熱帶氣旋路徑圖:
| Past HKWW Bulletins 本站發佈 |
Please click here for bulletins on this tropical cyclone. 請按這裡。
| Storm Development Overview 風暴發展概覽 |
Unless otherwise stated, all times below are in Hong Kong Standard Time (UTC+8)
除非特別註明,下文時間均為香港標準時間 (協調世界時加 8 小時)
SAOLA developed as tropical disturbance 91W just east of the Luzon Strait in the second half of August. It initially moved westwards slowly; the JTWC issued a tropical cyclone formation alert in the morning of August 23, and upgraded the system into tropical depression 09W at 2 am the next day. The HKO upgraded 91W into a tropical depression at the same time, while the JMA issued a gale warning. 09W was moving northwest at that time, but was then expected to turn south due to the development of a subtropical ridge in the South China Sea. It was expected to eventually turn northwards to complete the anticlockwise loop as the Pacific subtropical ridge would then strengthen and extend westwards to the east of 09W.
The northeasterly vertical wind shear that was affecting 09W eased later on August 24. This allowed convections to develop in all quadrants. The JMA upgraded 09W into a tropical storm in the afternoon and named it SAOLA. SAOLA turned west at that time, and started to dip south later that night. It also intensified steadily in the extremely warm seas just off Luzon. The JTWC upgraded SAOLA into a typhoon at 2 pm August 25, and the JMA followed suit 6 hours later. Within the next day, SAOLA developed into a 110-knot system (JTWC; 204 km/h) as its central dense overcast deepened and an eye emerged at the centre of the storm.
As SAOLA remained small, the Luzon landmass had no apparent effect on its strength even though the storm remained fairly close (less than 100 km) to land. At this stage, there was substantial uncertainty on SAOLA's track after its anticlockwise loop. While the majority of numerical models favoured a landfall at Taiwan, some of them indicated an earlier westward turn and that there was a chance for SAOLA to approach the Pearl River Estuary or even Hainan Island. Part of this uncertainty was due to the development of tropical disturbance 93W (which would later become tropical cyclone HAIKUI) east of SAOLA, which might affect the extent and timing of the westward extension of the subtropical ridge. As time passed, it became more and more likely that SAOLA would avoid Taiwan completely and would approach southern China instead.
The first peak in SAOLA's intensity occurred on August 27. Both the NMC and HKO designated the system a super typhoon. SAOLA decelerated that day as it started to turn east in response to the equatorial ridge further south and the weakening of the ridge in the South China Sea. There was some upwelling of cooler waters and, following an eyewall replacement cycle, SAOLA's central dense overcast shrank in size and its eye almost disappeared on satellite images. The JTWC lowered SAOLA's strength estimate to 90 knots (167 km/h), and the NMC and HKO downgraded SAOLA into a severe typhoon. Nevertheless, as SAOLA turned north, it started to intensify again on August 29. It underwent a period of rapid intensification during the day; by the morning of August 30, it reached an estimated intensity of 135 knots (250 km/h) by the JTWC, 230 km/h by the HKO, 62 m/s (223 km/h) by the NMC, and 105 knots (194 km/h) by the JMA. Citing Advanced Dvorak Technique estimates of SAOLA's T-Number to be around 6.7 to 6.8, the 135-knot strength was also SAOLA's peak intensity as assessed by the JTWC, despite subjective assessments of T7.0 which would correspond to a category-5 equivalent, 140-knot (259 km/h) system.
As the subtropical ridge developed in eastern China, SAOLA turned northwest in the night of August 29 and west-northwest in the morning of August 30. The storm almost crossed the Luzon Strait midway between the Philippine and Taiwan landmasses, and its intensity was largely unaffected by land interaction. With the exception of the ECMWF model which consistently predicted a landfall in eastern Guangdong, other numerical models were in favour of the forecast that SAOLA would not make landfall before turning west-southwest. There was however still some uncertainty due to the potential interaction between SAOLA and the incoming HAIKUI. A few models, most notably GFS, depicted another anticlockwise loop in the South China Sea which would bring SAOLA back to the east, a scenario similar to that of tropical cyclone TEMBIN in 2012.
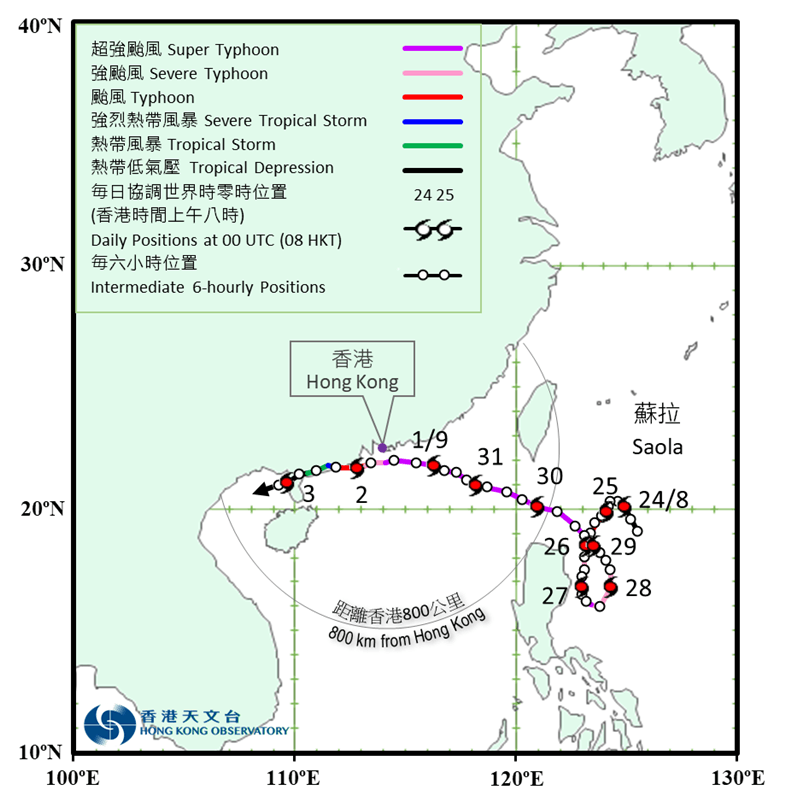
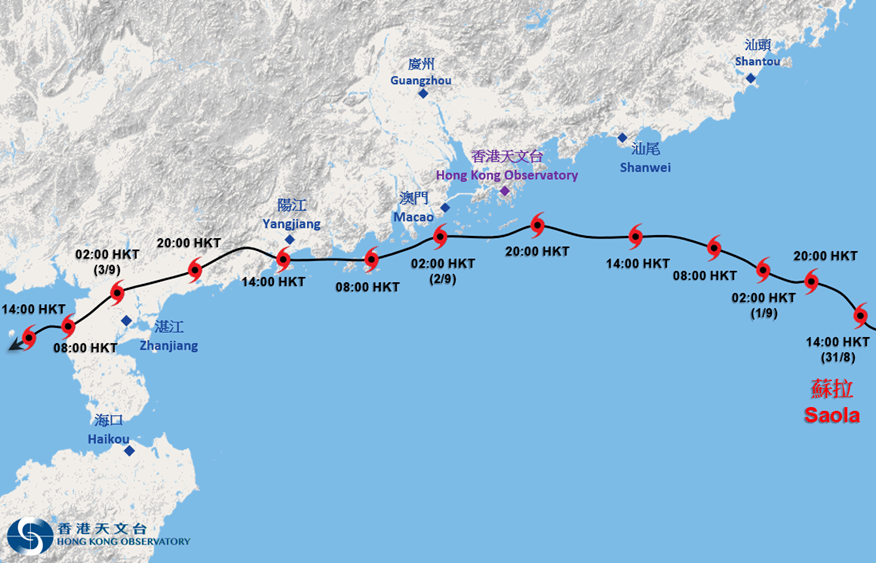
While in the South China Sea, SAOLA continued to move west-northwest on August 31 and September 1. Its peripheral convections dwindled as it came closer to southern China, but this did not affect its core intensity. It maintained a compact central dense overcast and a clear, round eye until the very last moment of its approach to the Pearl River Estuary. In the night of September 1, when SAOLA was less than 100 km from land, its core structure deteriorated and its eye gradually disappeared on satellite images as the storm passed to the south of Hong Kong. According to the HKO, SAOLA weakened into a severe typhoon while it crossed the Pearl River Estuary in the small hours of September 2, and further into a typhoon that morning. The NMC indicated that SAOLA made landfall in southern Zhuhai at around 3:30 am. Another landfall was registered at Hailing Island near Yangjiang in western Guangdong at around 1:50 pm that afternoon.
SAOLA moved westwards briefly and crossed western Guangdong in the afternoon of September 2 and early September 3. As a result, it suffered a greater decay in its intensity, and gradually weakened into a tropical storm. By the time it entered the Gulf of Tonkin in the morning of September 3, it had already weakened into a tropical depression. With most of its deep convections gone, SAOLA was reduced into an area of low pressure later that day.
八月下旬,熱帶擾動 91W 於呂宋海峽以東發展,此為蘇拉的前身。該擾動最初向西緩慢移動;聯合颱風警報中心於 8 月 23 日早上發出熱帶氣旋形成警報,並於翌日上午 2 時將其升格為熱帶低氣壓 09W。同時,香港天文台亦升格 91W 為熱帶低氣壓,而日本氣象廳則發出烈風警告。09W 當時向西北移動,但預料副熱帶高壓脊會於南海發展,從而令 09W 南轉。其後太平洋副高將逐漸增強並於 09W 以東西伸,令 09W 再度北移,完成其逆時針轉動的路徑。
影響 09W 的東北垂直風切變於 8 月 24 日稍後有所放緩,對流得以於風暴的所有象限發展。日本氣象廳於下午將 09W 升格為熱帶風暴,命名為蘇拉。蘇拉當時轉向偏西移動,並於晚間開始南移。由於呂宋對開海域海溫極高,蘇拉穩步增強,聯合颱風警報中心於 25 日下午 2 時將蘇拉升格為颱風,而日本氣象廳則於 6 小時後作出升格。翌日,蘇拉發展成中心風力達 110 節 (按照聯合颱風警報中心的估計,即每小時 204 公里) 的熱帶氣旋,其中心密集雲區變得深厚,風眼於風暴中心顯現。
雖然蘇拉距離呂宋陸地較近 (少於 100 公里),但由於它是一個較為細小的熱帶氣旋,陸地對其強度影響並不明顯。此時,數值模式對於蘇拉以逆時針轉動後的路徑出現重大分歧。大部分模式推算蘇拉會於台灣登陸,但亦有模式估計風暴路徑將較早轉向偏西,蘇拉有機會趨向珠江口甚至海南島一帶。造成此分歧的原因之一是蘇拉以東當時有另一熱帶擾動 93W 正在發展 (其後成為熱帶氣旋海葵),它有機會影響副高西伸的幅度及時機。隨著時間過去,蘇拉避開台灣而靠近華南的機會漸增。
蘇拉的強度於 8 月 27 日達到首個峰值,中國中央氣象台及香港天文台均將它定為超強颱風。隨著南海的副高減弱,蘇拉轉受其南方的赤道高壓脊影響,風暴減速並轉偏東移動。由於較涼海水上翻,加上風暴進行眼牆置換周期,蘇拉的中心密集雲區縮小,其風眼幾乎從衛星雲圖上消失。聯合颱風警報中心將蘇拉的強度估計下調至 90 節 (每小時 167 公里),而中央氣象台及香港天文台則將蘇拉降格為強颱風。但是,蘇拉於 29 日北轉後再度發展。它於當日日間曾快速增強,而至 30 日早上,各氣象機構對其強度估算分別為:聯合颱風警報中心 - 135 節 (每小時 250 公里);香港天文台 - 每小時 230 公里;中央氣象台 - 每秒 62 米 (每小時 223 公里);日本氣象廳 - 105 節 (每小時 194 公里)。當時,按照進階德沃夏克分析法得出蘇拉的 T 號碼為 6.7 至 6.8,聯合颱風警報中心以此為基礎而將蘇拉的巔峰強度定為 135 節,而非主觀判斷達 T7.0 的對應強度 - 即相當於五級超級颱風的 140 節 (每小時 259 公里)。
隨著副高於華東發展,蘇拉於 8 月 29 日晚間轉向西北移動,並於 30 日早上進一步轉向西北偏西。風暴幾乎橫過呂宋海峽中線,與台灣及菲律賓均保持一定距離,因此其強度幾乎未受地形影響。數值模式方面,除了 ECMWF 模式一直預測蘇拉於廣東東部登陸外,其他模式均預測蘇拉轉向西南偏西移動前不會登陸。但是,由於蘇拉與海葵有機會出現相互影響,當時的預測仍有一定變數,其中 GFS 模式更預料蘇拉或於南海以逆時針方向轉動並轉回東方,路徑酷似 2012 年的熱帶氣旋天秤。
進入南海後,蘇拉於 8 月 31 及 9 月 1 日繼續向西北偏西移動。隨著風暴靠近華南,其周邊對流有所減弱,但這對其核心強度並沒有影響。蘇拉的中心密集雲區仍然緊密,風眼清晰渾圓,此狀態維持至風暴非常接近珠江口為止。至 1 日晚上,蘇拉距離陸地少於 100 公里,其核心結構開始轉差,風眼於風暴橫過香港以南海域時逐漸從衛星雲圖上消失。香港天文台評估蘇拉於 2 日凌晨橫過珠江口時減弱為強颱風,並於當天早上進一步減弱為颱風。中央氣象台表示,蘇拉於上午約 3 時 30 分登陸珠海南部,並於下午約 1 時 50 分再次登陸廣東西部、位於陽江附近的海陵島。
蘇拉於 9 月 2 日下午及 3 日早段短暫西移,橫過廣東西部,因此其強度下降速度較快,並逐漸減弱為熱帶風暴。蘇拉於 3 日早上進入北部灣,當時它已減弱為熱帶低氣壓。隨著蘇拉大部分深層對流消失,它於當天稍後減弱為低壓區。
| Weather in Hong Kong During Approach 風暴影響時香港天氣狀況 |
Link to relevant HKO weather report bulletins:
30/8 ●
31/8 ●
1/9 ●
2/9
香港天文台相關天氣報告連結:30/8 ●
31/8 ●
1/9 ●
2/9
Initial preparations
SAOLA was the first tropical cyclone to necessitate the terminal #10 Hurricane Signal since tropical cyclone MANGKHUT in 2018. Due to the large uncertainty in SAOLA's track forecast, its approach was mostly unexpected locally until it started to take a steady west-northwesterly course across the Luzon Strait and northeastern South China Sea.
A trough affected southern China on August 28 and August 29; the weather in Hong Kong was unstable with showers. At around noon August 28, the HKO suggested that SAOLA would come to within 800 km of the territory on August 30 and might interact with tropical cyclone HAIKUI, leading to higher uncertainty in its track. In the morning of August 30, the HKO said that it would issue the #1 Standby Signal that evening and that SAOLA might be very close to the Pearl River Estuary on September 1 and 2.
Hong Kong was under the influence of the northeast monsoon on August 30. Together with the subsidence associated with SAOLA, winds were light and it was significantly drier than the days before. There were also sunny periods during the day. The #1 Standby Signal was issued at 5:40 pm, when SAOLA was about 610 km east-southeast of the territory. Immediately after the issuance of the #1 Signal, the HKO mentioned that the signal would be upgraded to #3 the day after.
At 6:30 am August 31, the HKO updated its 9-day weather forecast and predicted that winds of up to force 10 (storm force) would affect the territory later on September 1. Winds could even reach up to force 12 (hurricane force) offshore and on high ground. This did not only suggest that the #8 Gale or Storm Signal would very likely be issued, but there was also the potential for the #9 (Increasing Gale or Storm) or even the #10 (Hurricane) Signal to be issued. By that time, the HKO's forecast track had already suggested a "direct hit" scenario, where SAOLA was expected to pass within 100 km south of Hong Kong.
The HKO issued the #3 Strong Wind Signal at 3:40 pm August 31, after previously indicating that the signal would be up between 3 and 5 pm that day. SAOLA was about 380 km east-southeast of Hong Kong at that time. The HKO also mentioned that the #8 Signal would be issued the day after, and that serious flooding might occur at low-lying areas due to the storm surge. Local winds, then coming in from the north, were still light when the #3 Signal was issued. Due to the potential devastation caused by SAOLA, the HK government organized a joint press conference at 4:30 pm that day. Mr. Chan Kwok-ki, the Chief Secretary for Administration, announced that the #8 Signal would be issued between 2 and 5 am September 1. All schools would be suspended that day - this meant that the first day of school in the 2023-24 academic year would be postponed to Monday, September 4. Dr. Chan Pak Wai, Director of the HKO, mentioned that the tides at Tolo Harbour, Victoria Harbour and Tai O would be just lower than or almost reach historic levels during tropical cyclones WANDA in 1962 or HATO in 2017. He also said that it would be necessary to issue the #10 Hurricane Signal if winds reached hurricane force, which was already in the forecast at that time.
Various precautionary measures were implemented after the announcement of the upcoming signal change. Cargo handling was suspended at 5 pm August 31. Some ferry services connecting the outlying islands were also suspended near or after 5 pm. Daytime bus services remained normal but overnight services that night were suspended. All high-speed rail services departing from or arriving at West Kowloon Station since noon September 1 were cancelled.
The #8 Signal and SAOLA's approach on September 1
SAOLA's outermost rainbands reached Hong Kong near sunset on August 31. The rain was however short-lived and there was no noticeable increase in wind speed. Near midnight September 1, the HKO mentioned that the #8 Signal would be issued at 2:40 am. The Pre-No. 8 Special Announcement was therefore issued at 12:40 am to provide a 2-hour warning in advance of the signal change. SAOLA was about 280 km east-southeast of Hong Kong when the #8 Northwest Gale or Storm Signal was issued. The signal was issued very early to give the public sufficient time to make preparations for the storm, as Tate's Cairn was the only station to register strong force winds at that time. The HKO warned that SAOLA would skirt within 100 km south of Hong Kong that night and in the next morning, and that higher signals might be needed.
SAOLA's circulation was shrinking in size when it approached Hong Kong. As a result, its rainbands only started to affect Hong Kong again since around 7 to 8 am September 1. North to northwesterly winds started to strengthen at offshore locations and on high ground; strong winds were recorded at locations such as Waglan Island, Green Island, Lamma Island, Peng Chau and Cheung Chau in the morning. The Government Flying Service sent an aircraft to SAOLA's vicinity that morning; meteorological data and images of SAOLA's eyewall were obtained during the trip (link to press release). The HKO adjusted SAOLA's intensity upwards from 205 km/h to 210 km/h at 8 am, possibly as a result of the data collected. Also, the storm surge superimposed on the high tide that morning and gave rise to sea levels exceeding 3 metres above chart datum in Victoria Harbour and Tai O, leading to mild flooding in some low-lying areas. The HKO warned that water levels in eastern parts of Hong Kong could be similar to those reached during cyclone MANGKHUT in 2018 later that night.
As SAOLA's core circulation drew closer to Hong Kong, the HKO said it would consider issuing higher signals around the evening of September 1. Winds at various places started to strengthen steadily since the early afternoon. Gales were first recorded at Tate's Cairn and Waglan Island near 1-2 pm, and storm force winds were registered several hours later. Almost all flights arriving at or leaving the Hong Kong International Airport after 2 pm were cancelled. Rain gradually turned frequent and strong force winds became widespread over the territory by around 5 pm, when SAOLA was about 110 km from Hong Kong. In its tropical cyclone bulletin at 4 pm, the HKO suggested that the #9 Signal would be issued between 6 and 8 pm in light of the expected surge in wind speed. Two hours later, the predicted water level at Tolo Harbour that night was increased from 5 metres to 6 metres above chart datum. This would imply a storm surge of around 4 metres, exceeding the level encountered during cyclone WANDA's approach in 1962 that devastated the area.
SAOLA passing at a close distance
The #9 Increasing Gale or Storm Signal was issued at 6:20 pm, when SAOLA was 90 km east-southeast of the HKO. It was mentioned that SAOLA's eyewall was only 30 km east of the HKO at that time. Northwesterly winds reaching gale force were recorded in most offshore and elevated locations. Green Island also joined Tate's Cairn and Waglan, recording storm force winds for the first time after 6 pm.
SAOLA's eyewall was about to reach Hong Kong by 7 pm. Winds in eastern parts of Hong Kong turned northerly and strengthened further. Hurricane force winds were first registered at Tate's Cairn and Waglan Island near 8 pm. The Amber Rainstorm Warning was issued at 7:45 pm. Following the arrival of the most intense convective patch in the western side of the eyewall, Waglan Island experienced a surge in wind speeds to more than 140 km/h at 8 pm. This confirmed that hurricane force winds were affecting Hong Kong even after converting such speeds to near sea level. In response to this, the HKO issued the #10 Hurricane Signal at 8:15 pm, when SAOLA was around 60 km southeast of the Observatory.
Most parts in Hong Kong experienced the strongest winds in the hours following the issuance of the #10 Signal. Sustained winds at Waglan Island peaked at 159 km/h at around 9:30 pm, coming in from the northeast. Tate's Cairn and Ngong Ping also recorded winds in excess of 140 km/h. Both anemometers at Cheung Chau registered hurricane force winds, with the one at Cheung Chau Beach peaking at 141 km/h. Other locations whose winds reached hurricane force include Green Island (140 km/h) and Hong Kong Sea School (124 km/h). Gusts at some locations reached 180 km/h during SAOLA's approach. According to the data from Chinese authorities, a station located at Dangan Island, about 15 km south of Waglan Island, briefly recorded sustained winds in excess of 51 m/s (184 km/h) near 9 pm. The station was within the stronger western eyewall at that time, and was within 10-20 km of the storm's centre. This could be an indication that SAOLA was very close to being a super typhoon, if not still being so, at that time where its eyewall structure was deteriorating. Several other nearby stations also recorded wind speeds in excess of 40 m/s (144 km/h).
In Hong Kong, the wind direction turned east after 10 pm. Areas within the Victoria Harbour became exposed and saw a surge in wind speeds. Storm force winds were recorded at Central Pier and North Point, while gale force winds were recorded at the Kowloon Star Ferry Pier. The Special Announcement on Flooding in the Northern New Territories (referred to as the Special Announcement below) was issued at 10:05 pm, where it was mentioned that over 115 mm of rain had been recorded in Pat Heung and Kam Tin. SAOLA was closest to Hong Kong near 11 pm, when it was just 30 km south-southwest of the HKO (Note: The time and location of SAOLA's closest point of approach were amended to 9 pm and 40 km south-southeast in HKO's TC report issued in February 2024). On radar images, it was evident that SAOLA was weakening while it passed to the south of Hong Kong. There was a large area in the northern and eastern sides immediately adjacent to SAOLA's eye that was devoid of significant rainbands. The eye itself could also be seen collapsing while it approached the Pearl River Estuary. The HKO downgraded SAOLA into a severe typhoon at midnight September 2.
Moderating winds and the resumption of normal activities
Winds at most locations started to moderate after midnight, especially in eastern Hong Kong. The rain also became less intense; the Amber Rainstorm Warning was cancelled at 1 am, while the Special Announcement was cancelled later at 4:30 am. Hurricane force winds were no longer observed at Tate's Cairn or Waglan Island by midnight. Even for stations that were located in western Hong Kong such as Cheung Chau and Ngong Ping, winds moderated to below hurricane force level after 1 am. Hong Kong was not subject to the influence of any strong rainbands after midnight. Nevertheless, the HKO indicated in its 2 am tropical cyclone bulletin that western parts of Hong Kong may still be occasionally affected by hurricane force winds, and that a lower signal would be considered between 3 and 6 am. It also mentioned that the water level at Tai Po had previously reached 4 metres above chart datum, although this apparently did not correspond to the measurement taken at Tai Po Kau, which was about 3.3 metres recorded before midnight.
The #8 Southeast Gale or Storm Signal was issued at 3:40 am September 2. By this time, SAOLA had moved to around 100 km west-southwest of the HKO and was making landfall in southern Zhuhai. The HKO assured the public that the #8 Signal would remain in force before noon, meaning that most workers would not need to report for duty on Saturday morning. In the initial hours following the issuance of the #8 Signal, gale to storm force winds were still recorded at various places over the territory, again mostly in offshore areas and on high ground. However, the wind direction never really turned southeast proper at many locations. As a significant amount of rainfall had already fallen, the Landslip Warning was issued at 5:50 am, which lasted almost 12 hours.
After the passage of several more rainbands, the rain intensity declined further in the late morning of September 2. Except for a few stations, winds at most places diminished to below gale force level by midday. In its tropical cyclone bulletin at 10 am, the HKO further delayed the time of cancelling the #8 Signal to after 4 pm. The predicted high tide at around 11 am occurred with no major flooding reported, as the storm surge was only 0.5 metres or less. Flights at the Hong Kong International Airport resumed gradually in the afternoon.
The #3 Strong Wind Signal was eventually issued at 4:20 pm September 2, replacing the #8 Southeast Signal. SAOLA had already weakened into a severe tropical storm by then, and was about 260 km away from Hong Kong. Even strong winds were restricted to offshore and elevated locations at that time. Various transport services resumed after the #8 Signal was cancelled. As SAOLA receded further, the HKO replaced the #3 Signal by the #1 Standby Signal at 8:20 pm, and the latter was cancelled at 11:40 pm that night. Due to the stable air mass associated with HAIKUI's subsidence, the local weather improved quickly on September 3, and it was mainly fine during the day.
During SAOLA's approach, the HK government received more than 3,000 reports of fallen trees, 21 flooding reports and 7 landslide reports. 86 people were injured and sought medical assistance at the Accident and Emergency Department of public hospitals. Although SAOLA approached Hong Kong as a super typhoon, the storm's declining wind field spared the territory a major disaster. Extremely strong winds were relatively short-lived, and the storm surge was much less severe than that experienced during cyclone MANGKHUT in 2018. The effect of SAOLA's weakening trend could also be seen in Macau, where none of the stations registered sustained hurricane force winds. The #10 Signal was nevertheless in force between 1 and 6 am September 2 in the enclave.
初期準備
蘇拉是自 2018 年的山竹以來首個令香港天文台發出最高十號颶風信號的熱帶氣旋。由於蘇拉的路徑預測變數一直頗大,直至它於呂宋海峽及南海東北部穩定向西北偏西移動之前相信無人能預料它會直趨香港。
一道低壓槽於 8 月 28 及 29 日影響華南,香港天氣不穩定並有驟雨。天文台於 28 日約中午 12 時表示蘇拉將於 30 日進入本港 800 公里範圍,並有機會與熱帶氣旋海葵發生相互作用,令蘇拉的路徑出現較大變數。30 日早上,天文台表示將於當天黃昏發出一號戒備信號,蘇拉或於 9 月 1 至 2 日頗為接近珠江口。
香港於 8 月 30 日受夏末秋初的東北季候風影響,加上蘇拉的外圍下沉氣流,當天風勢微弱,而且明顯較之前幾天乾燥,日間部分時間有陽光。一號戒備信號於下午 5 時 40 分發出,當時蘇拉位於香港東南偏東約 610 公里。天文台於一號信號發出之時已表明會於翌日改發三號強風信號。
天文台於 8 月 31 日上午 6 時 30 分更新九天天氣預報,預料 9 月 1 日稍後將吹達 10 級風 (暴風),離岸及高地更達 12 級 (颶風)。這預測不單顯示需要發出八號烈風或暴風信號的機會很高,而且亦有機會需要發出九號烈風或暴風風力增強甚至十號颶風信號。當時天文台的路徑圖已預料蘇拉會直趨本港,並於香港以南 100 公里內掠過。
天文台其後表示將於 8 月 31 日下午 3 至 5 時之間改發三號強風信號,而最終該信號於下午 3 時 40 分發出,蘇拉當時位於香港東南偏東約 380 公里。天文台亦表示將於翌日改發八號信號,而低窪地區將可能受風暴潮影響而出現嚴重水浸。三號信號發出之時本港吹北風,而風勢仍然微弱。由於蘇拉或為香港帶來嚴重破壞,港府於當天下午 4 時 30 分舉行聯合記者會。會上政務司司長陳國基宣佈,天文台將於 9 月 1 日上午 2 時至 5 時之間改發八號信號,而當天所有學校停課,亦即 2023-24 學年的開學日將順延至 9 月 4 日 (周一)。天文台台長陳柏緯博士指出,吐露港、維港及大澳的潮位將略低於或接近 1962 年溫黛及 2017 年天鴿吹襲時的歷史高度。他亦說天氣預測已提到離岸及高地風力可能達颶風的程度,而如此情況真的出現,就可能需要發出十號颶風信號。
政府表示八號信號將會發出後,各類防風措施逐步執行。所有貨櫃碼頭交收於 8 月 31 日下午 5 時起停止,部分往來離島的渡輪服務亦於接近或下午 5 時後暫停。日間巴士路線維持正常服務,但當晚的通宵服務則取消。所有於 9 月 1 日中午後往來西九龍站的高鐵班次亦取消。
八號信號及蘇拉於 9 月 1 日逐漸靠近
蘇拉的外圍雨帶於 8 月 31 日的日落時份到達本港,但雨勢短暫,風力並沒有明顯上升。接近 9 月 1 日午夜,天文台表示八號信號將於上午 2 時 40 分發出,而預警八號熱帶氣旋警告信號之特別報告亦於改發八號信號前兩小時、即上午 12 時 40 分發出。八號西北烈風或暴風信號發出之時,蘇拉位於香港東南偏東約 280 公里。該信號發出時間甚早,當時只得大老山吹強風,市民有充足時間作出準備。天文台警告,蘇拉將於當晚及翌日早上於香港以南 100 公里內掠過,並可能需要發出更高信號。
蘇拉靠近香港時,其環流正在逐漸縮小。因此,其雨帶遲至 9 月 1 日上午 7 至 8 時左右才開始影響本港。香港當時吹北至西北風,離岸及高地風勢開始增強,早上起橫瀾島、青洲、南丫島、坪洲及長洲等地吹強風。政府飛行服務隊於當天上午派定翼機到蘇拉附近,並獲取氣象數據及蘇拉眼壁的影像 (新聞稿連結)。天文台於上午 8 時將蘇拉的強度由每小時 205 公里上調至 210 公里,這或是因應所收集的數據而作出的調整。另一方面,1 日早上適逢漲潮,受風暴潮疊加影響,維港及大澳水位上升至海圖基準面以上逾 3 米,部分低窪地區出現輕微水浸。天文台警告,香港東部沿海地區當晚水位有可能上升至差不多 2018 年山竹襲港時的水平。
隨著蘇拉的核心環流進一步靠近香港,天文台表示將於 9 月 1 日黃昏前後考慮改發更高信號。下午初段,本港多區風勢開始穩步增強。大老山及橫瀾島率先於下午 1 至 2 時左右吹烈風,數小時後開始吹暴風。幾乎所有於下午 2 時後抵港及離港的航班均被取消。至下午約 5 時,蘇拉距港約 110 公里,本港雨勢漸趨頻密,強風影響範圍變得更為廣泛。由於預料風勢會急速上升,天文台於下午 4 時的熱帶氣旋警報中表示會於下午 6 至 8 時改發九號信號。兩小時後,天文台預測吐露港的潮水高度由 5 米上調至 6 米,即估計風暴潮達 4 米,超過 1962 年溫黛為該區造成毀滅性破壞時的水位紀錄。
蘇拉於近距離掠過
九號烈風或暴風風力增強信號於下午 6 時 20 分發出,蘇拉當時位於天文台東南偏東約 90 公里,而其眼壁距離天文台更只有 30 公里。離岸及高地大部分地區已吹西北烈風,而繼大老山及橫瀾島後,青洲於下午 6 時亦開始吹暴風。
下午 7 時,蘇拉的眼壁已非常接近香港,本港東部地區轉吹北風,風速進一步上升。大老山及橫瀾島於下午約 8 時開始吹颶風,而天文台於下午 7 時 45 分發出黃色暴雨警告。隨著蘇拉對流雲帶最為強勁的西面眼壁到達,橫瀾島的風速於下午 8 時上升至超過每小時 140 公里,即使將此風速換算為近海平面亦達颶風程度。因此,天文台於下午 8 時 15 分改發十號颶風信號,當時蘇拉的中心位於天文台東南約 60 公里。
本港多區風勢於十號信號發出後數小時內最為猛烈。橫瀾島於下午約 9 時 30 分錄得最高持續風速達每小時 159 公里,吹東北颶風。大老山及昂坪風速均超過每小時 140 公里。長洲的兩個風速站均錄得颶風風速,其中長洲泳灘達每小時 141 公里。青洲及香港航海學校風速均達颶風水平,分別為每小時 140 及 124 公里。蘇拉襲港期間,部分地區錄得最高陣風達每小時 180 公里。根據中央氣象台的數據,位於橫瀾島以南約 15 公里的擔桿島,島上氣象站曾於下午 9 時左右短暫錄得持續風速超過每秒 51 米 (每小時 184 公里)。當時該站位處風暴較強的西部眼牆中,距離風暴中心約 10 至 20 公里。這似乎顯示雖然當時蘇拉的眼牆結構正在轉差,但它仍然非常接近甚至達到超強颱風強度。該島附近的氣象站亦曾錄得每秒逾 40 米 (每小時 144 公里) 的風速。
香港方面,風向於下午 10 時後轉為偏東,維港一帶地區變得當風,風力隨即上揚。中環碼頭及北角均錄得暴風風速,而九龍天星碼頭亦吹烈風。天文台於下午 10 時 05 分發出新界北部水浸特別報告,並指出八鄉及錦田已錄得超過 115 毫米雨量。蘇拉於下午 11 時左右最接近香港,於天文台西南偏南約 30 公里處掠過 (註:天文台於 2024 年 2 月發表的熱帶氣旋報告中將蘇拉最接近香港的時間及位置分別修訂為下午 9 時及東南偏南 40 公里)。雷達圖上可清晰見到蘇拉通過香港以南海域時正在減弱,其風眼於橫過珠江口期間崩潰。天文台於 9 月 2 日午夜 12 時將蘇拉降格為強颱風。
風勢緩和,正常活動恢復
午夜後多區風力開始緩和,尤其是香港東部,而雨勢亦見減弱。天文台於 9 月 2 日上午 1 時取消黃色暴雨警告,而新界北部水浸特別報告亦於上午 4 時 30 分取消。午夜時大老山及橫瀾島已沒有錄得颶風,而位處香港西部的地點如長洲和昂坪,其風力亦於上午 1 時後下降至颶風程度以下,午夜後香港亦不再受任何強雨帶影響。然而,天文台在上午 2 時的熱帶氣旋警報中提及本港西部仍間中受颶風影響,將於上午 3 至 6 時考慮改發較低信號。同時,天文台表示大埔的水位曾達海圖基準面以上約 4 米,但似乎這並非大埔滘的水位,因該處午夜前達到的最高水位只是 3.3 米左右。
八號東南烈風或暴風信號於 9 月 2 日上午 3 時 40 分發出,此時蘇拉已移至天文台西南偏西約 100 公里,並正於珠海南部登陸。天文台表示八號信號將至少維持至中午 12 時,大部分僱員周六上午無需上班。八號信號發出後首數小時,本港多處尤其是離岸及高地仍然吹烈風或暴風,但大多數地區始終未能完全轉吹東南風。由於已累積一定雨量,山泥傾瀉警告於上午 5 時 50 分發出,並維持近 12 小時。
幾道雨帶通過後,雨勢於 9 月 2 日上午後段進一步減弱。除少數地點外,風速於中午時份已大致緩和至不足烈風程度。天文台於上午 10 時的熱帶氣旋警報中將八號信號取消時間推遲至下午 4 時後。當天預計漲潮時間為早上 11 時,但並未出現嚴重水浸,風暴潮普遍不超過 0.5 米。香港國際機場航班於下午逐步恢復。
三號強風信號於 9 月 2 日下午 4 時 20 分發出,取代八號東南信號。蘇拉當時已減弱為熱帶風暴,距離香港約 260 公里,而本地強風只局限於離岸及高地。八號信號取消後,本地交通服務陸續恢復。隨著蘇拉進一步遠離,天文台於下午 8 時 20 分改發一號戒備信號,並於下午 11 時 40 分取消所有熱帶氣旋信號。與氣旋海葵下沉氣流相關的穩定氣團於 9 月 3 日影響本港,天氣因而快速改善,日間大致天晴。
蘇拉襲港期間,政府接獲超過 3,000 宗塌樹、21 宗水浸及 7 宗山泥傾瀉報告。86 人在風暴中受傷並前往公立醫院急症室治理。雖然蘇拉以超強颱風姿態靠近,但其不斷縮小的風圈令本港倖免於難;極強風力維持時間相對較短,而風暴潮亦遠較 2018 年山竹襲港時輕微。澳門的觀測亦可印證蘇拉減弱的趨勢,該地十號信號雖然於 9 月 2 日上午 1 至 6 時之間生效,但並沒有氣象站錄得持續颶風風速。
| Image Gallery 圖片庫 |
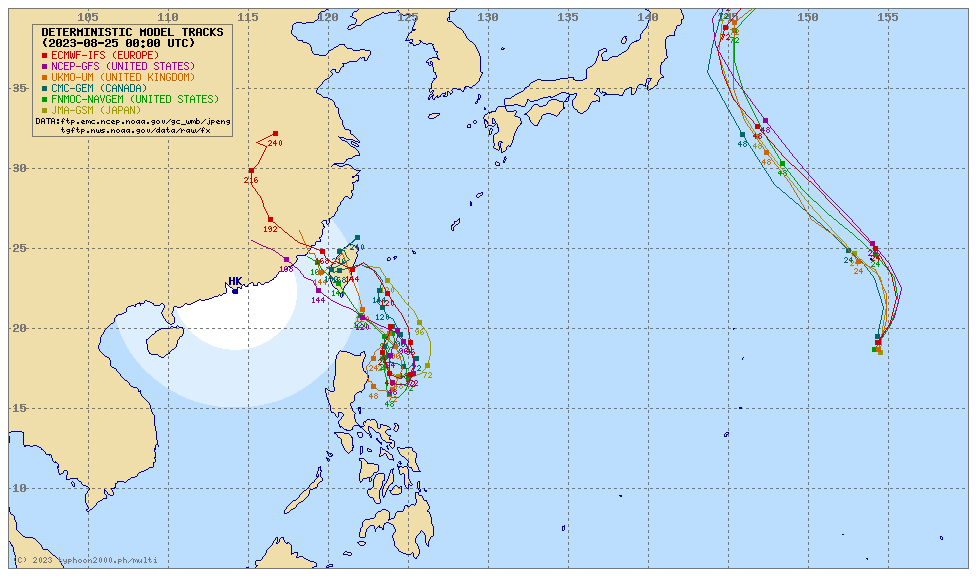
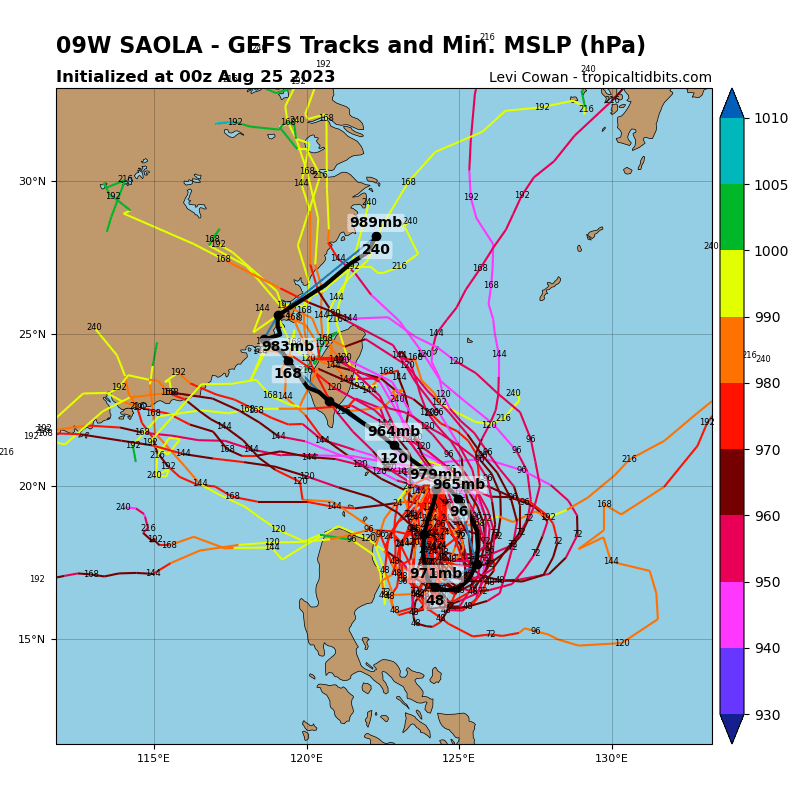

Figure 1 - Numerical model forecasts at 8 am August 25 (top - deterministic tracks; bottom left - GFS ensemble; bottom right - ECMWF ensemble) (source: Tropical Tidbits, Easterlywave, Typhoon2000)
圖 1 - 8 月 25 日上午 8 時之數值模式預報 (上 - 確定性預報;左下 - GFS 集成預報;右下 - ECMWF 集成預報) (來源:Tropical Tidbits, Easterlywave, Typhoon2000)

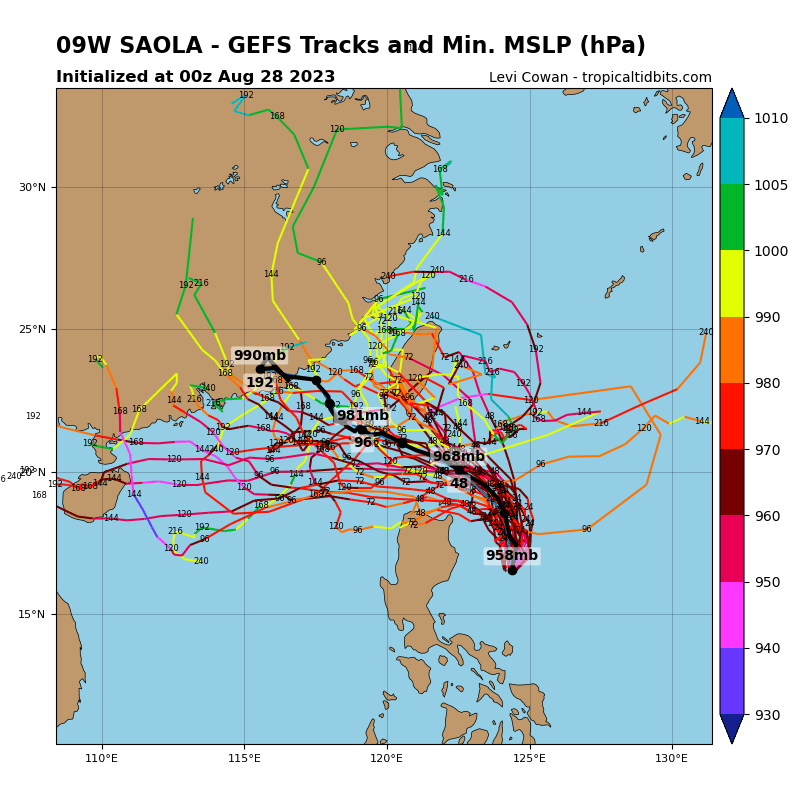

Figure 2 - Numerical model forecasts at 8 am August 28 (top - deterministic tracks; bottom left - GFS ensemble; bottom right - ECMWF ensemble) (source: Tropical Tidbits, Easterlywave, Typhoon2000)
圖 2 - 8 月 28 日上午 8 時之數值模式預報 (上 - 確定性預報;左下 - GFS 集成預報;右下 - ECMWF 集成預報) (來源:Tropical Tidbits, Easterlywave, Typhoon2000)


Figure 3 - ECMWF forecast on August 23 predicting SAOLA to make landfall at Hong Kong on August 31 (left - mean sea level pressure; right - wind speed)
圖 3 - ECMWF 於 8 月 23 日曾預測蘇拉於 8 月 31 日登陸香港 (左 - 平均海平面氣壓;右 - 風速)

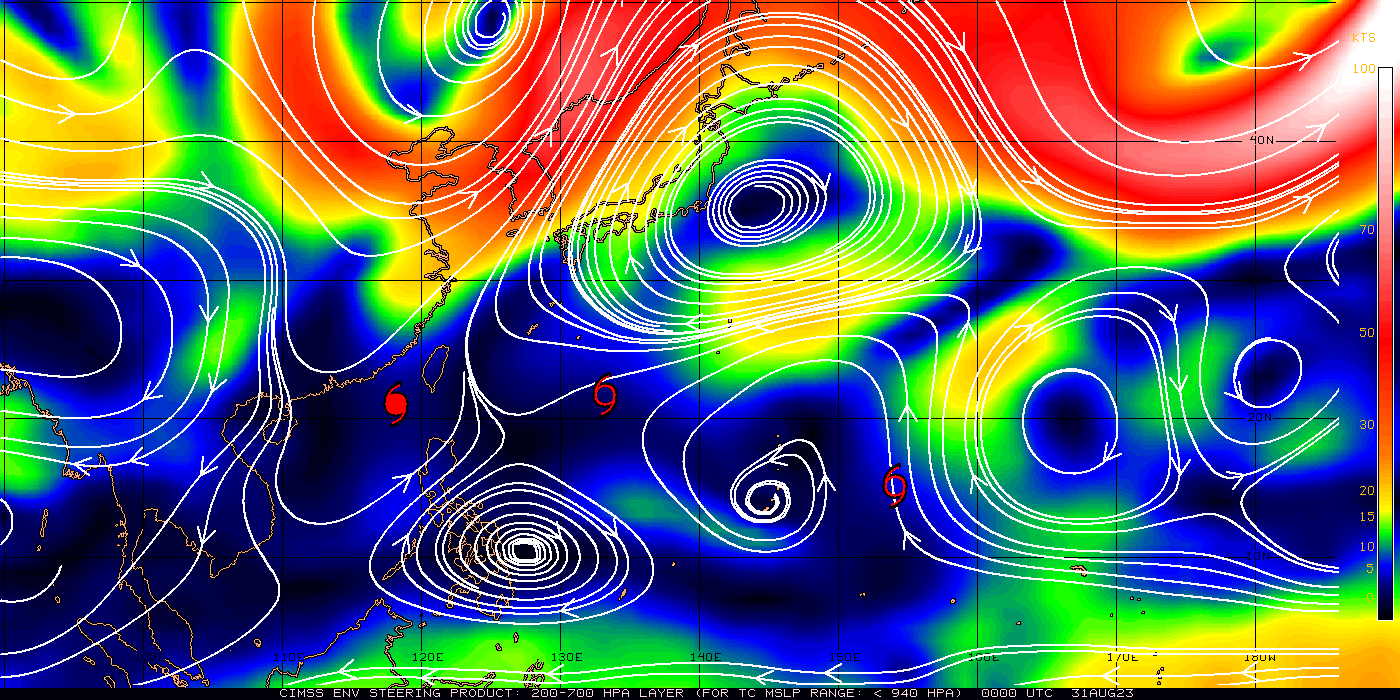
Figure 4 - Steering flow chart at 8 am August 26 (top) and 31 (bottom)
圖 4 - 8 月 26 日 (上) 及 31 日 (下) 上午 8 時之駛流場分佈圖

Figure 5 - Vertical wind shear distribution at 8 am August 31
圖 5 - 8 月 31 日之垂直風切變分佈圖

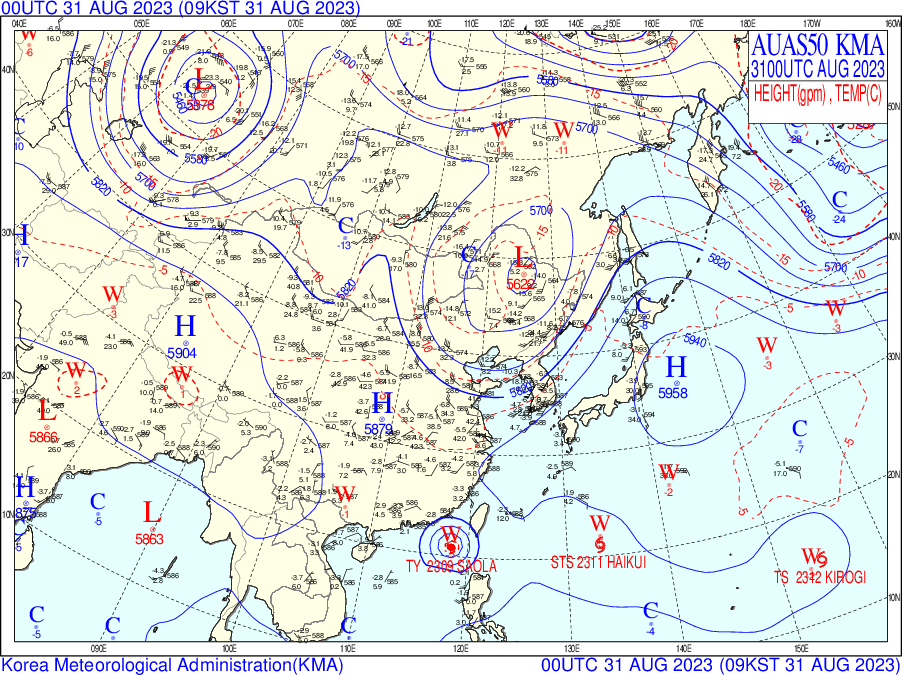
Figure 6 - 500 hPa weather map at 8 am August 26 (left) and 31 (right)
圖 6 - 8 月 26 日 (左) 及 31 日 (右) 上午 8 時之 500 百帕天氣圖

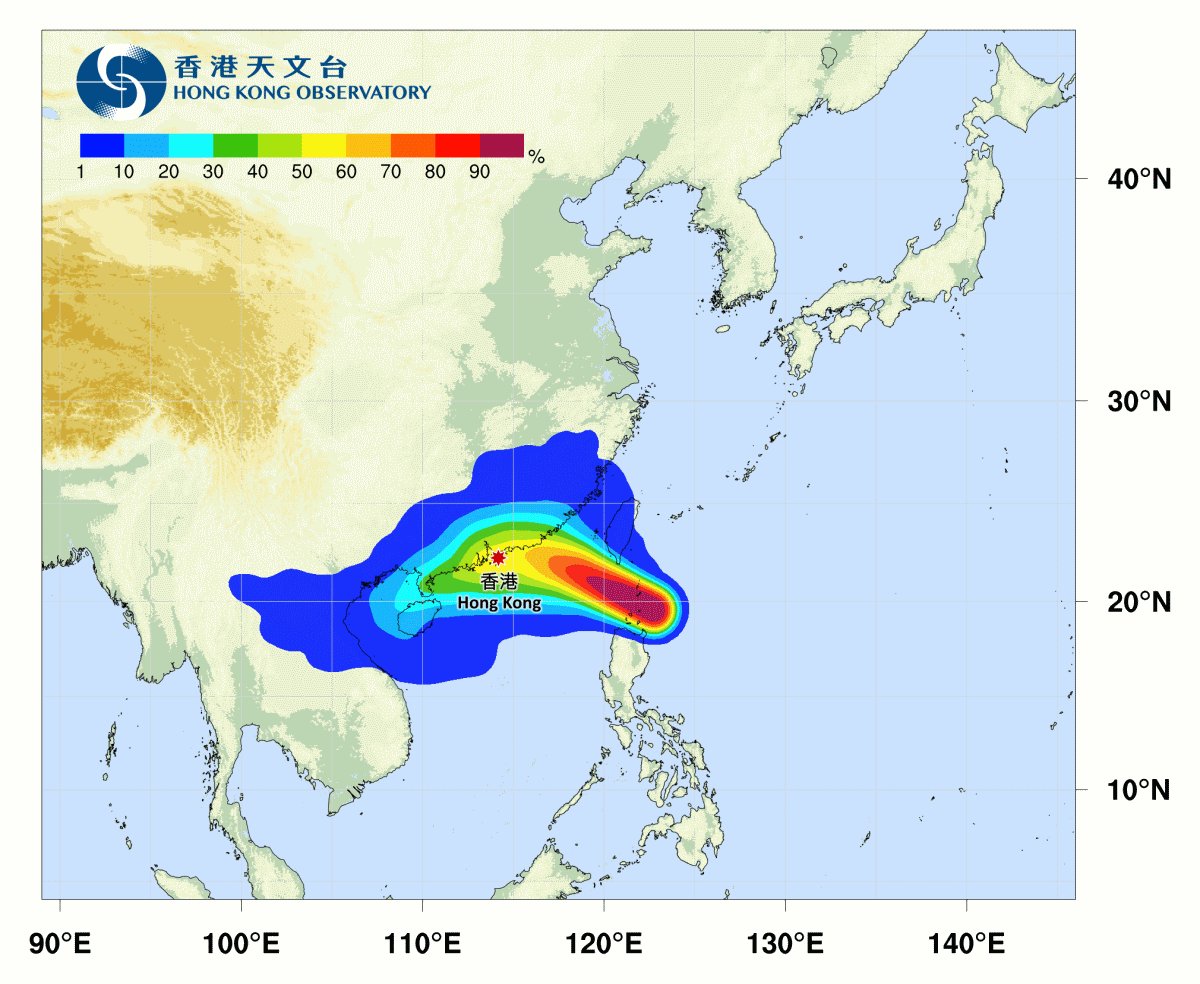
Figure 7 - Tropical cyclone probability forecast maps issued by the HKO on August 27 (left) and 30 (right)
圖 7 - 8 月 27 日 (左) 及 30 日 (右) 香港天文台發出之熱帶氣旋路徑概率預報圖


Figure 8 - HKO's forecast tracks at 8 pm August 28 (left) and 8 am August 29 (right)
圖 8 - 8 月 28 日下午 8 時 (左) 及 29 日上午 8 時 (右) 香港天文台之預測路徑圖


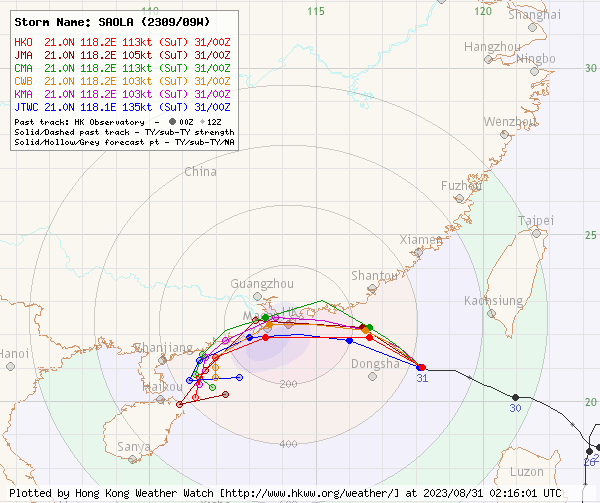
Figure 9 - Forecast tracks from various official agencies on August 27 (left), 29 (middle) and 31 (right)
圖 9 - 8 月 27 日 (左)、29 日 (中) 及 31 日 (右) 各官方氣象台之預測路徑圖
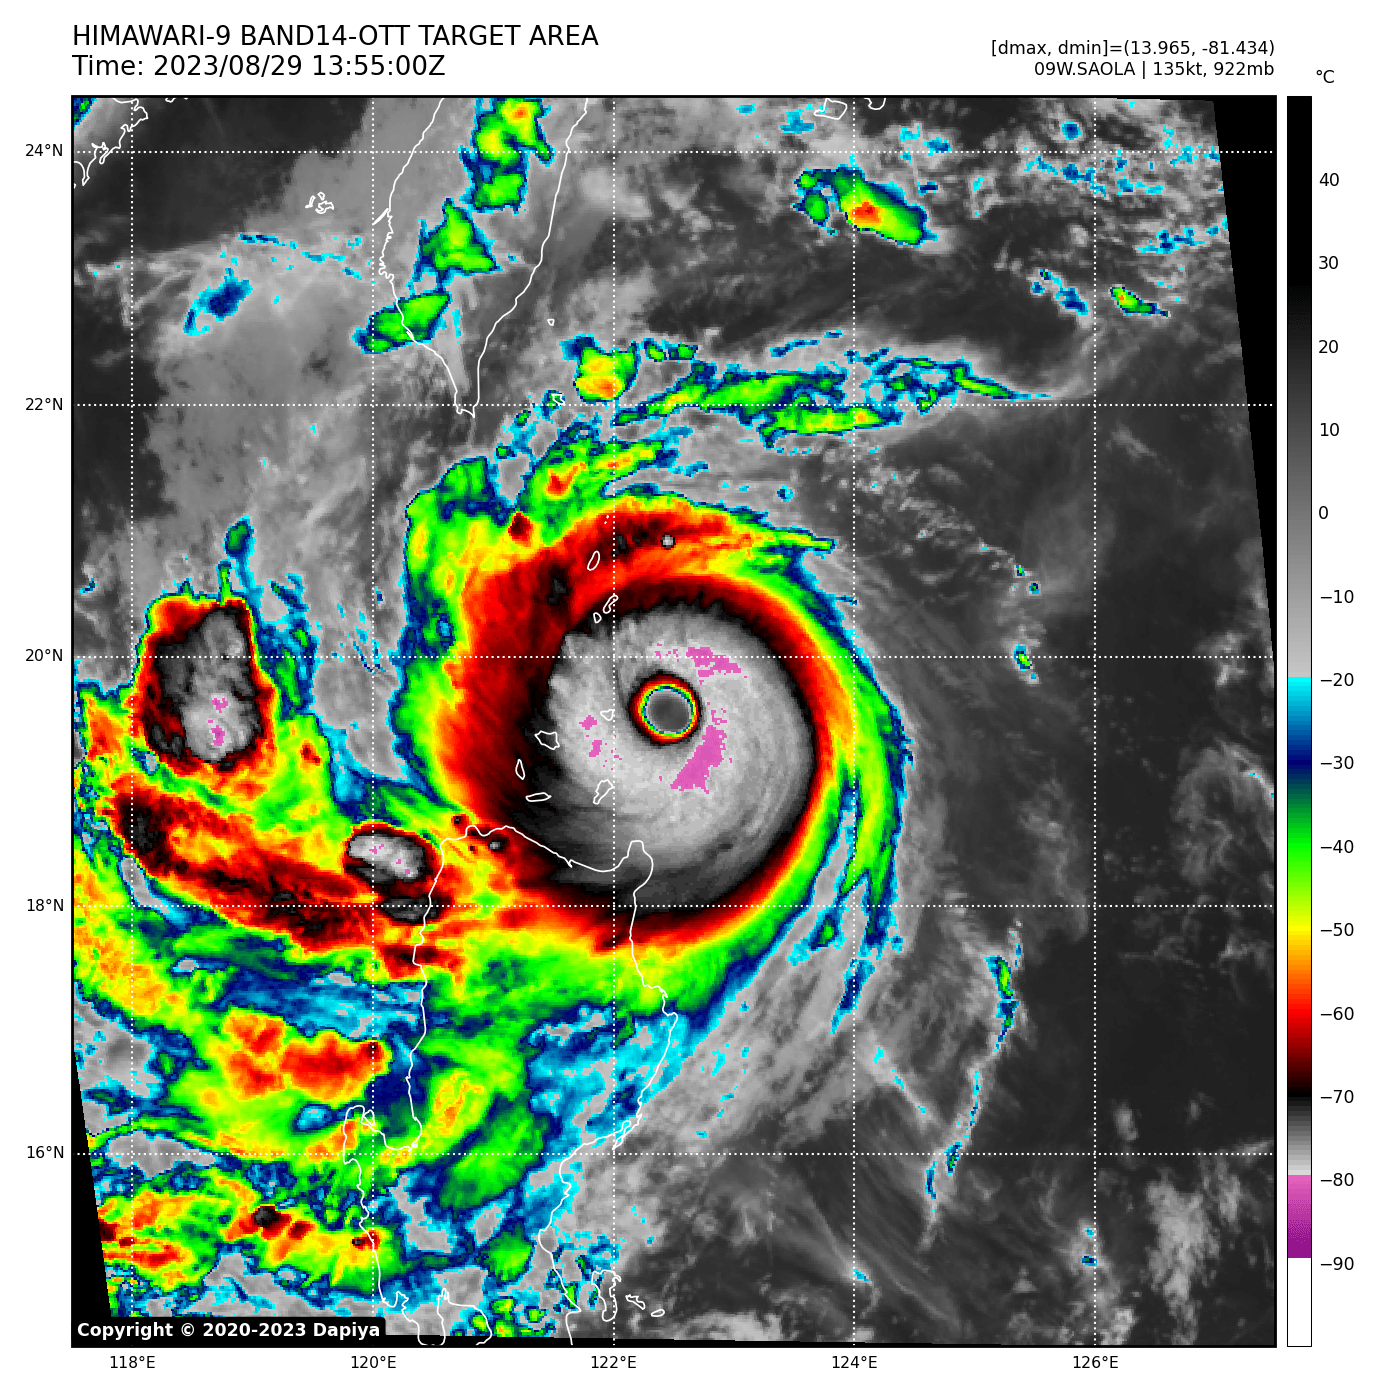
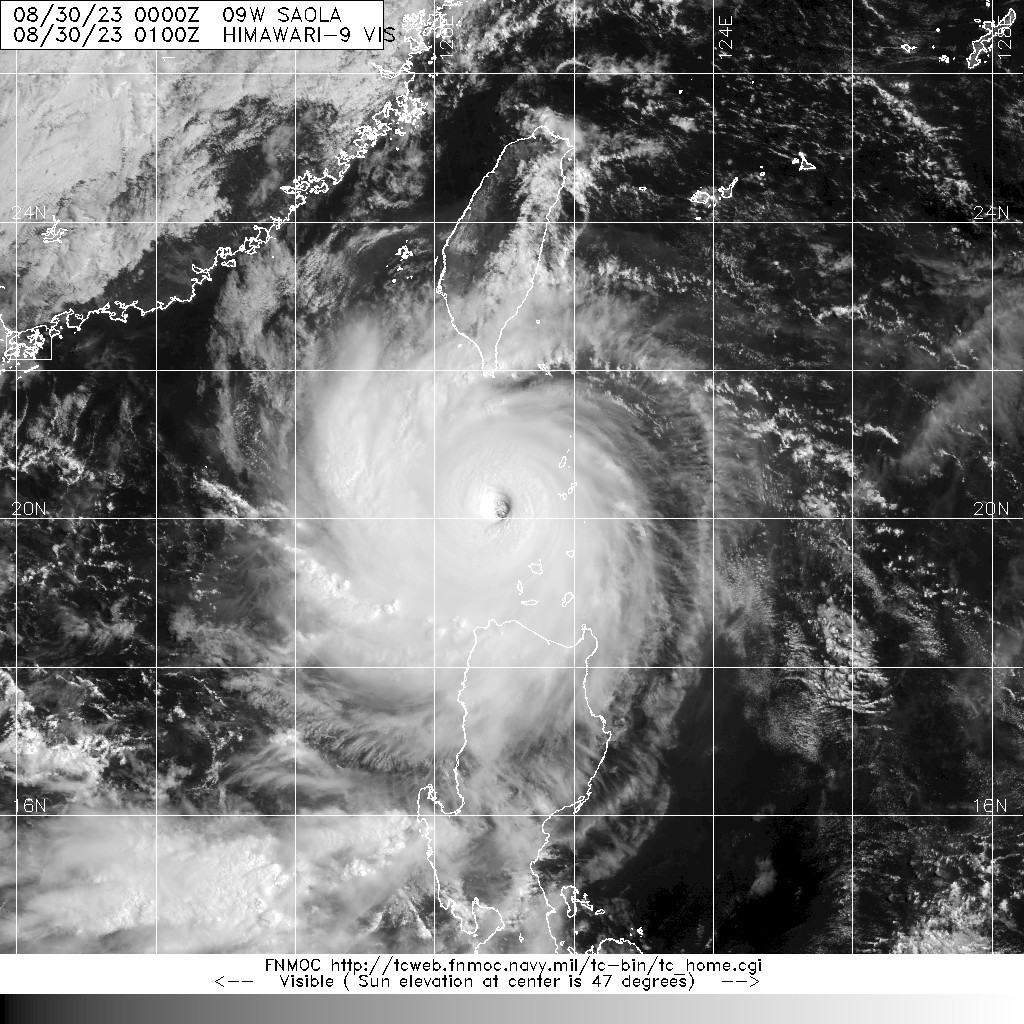
Figure 10 - Colour-enhanced infrared (left) and visible light (right) satellite images showing SAOLA near peak strength on August 29 and 30
圖 10 - 色調強化紅外線 (左) 及可見光 (右) 衛星雲圖顯示蘇拉於 8 月 29 至 30 日接近巔峰強度時的姿態


Figure 11 - Wind field analysis at 9:47 am August 29 (left) and 9:05 pm August 31 (right)
圖 11 - 8 月 29 日上午 9 時 47 分 (左) 及 31 日下午 9 時 05 分 (右) 之風場掃描圖
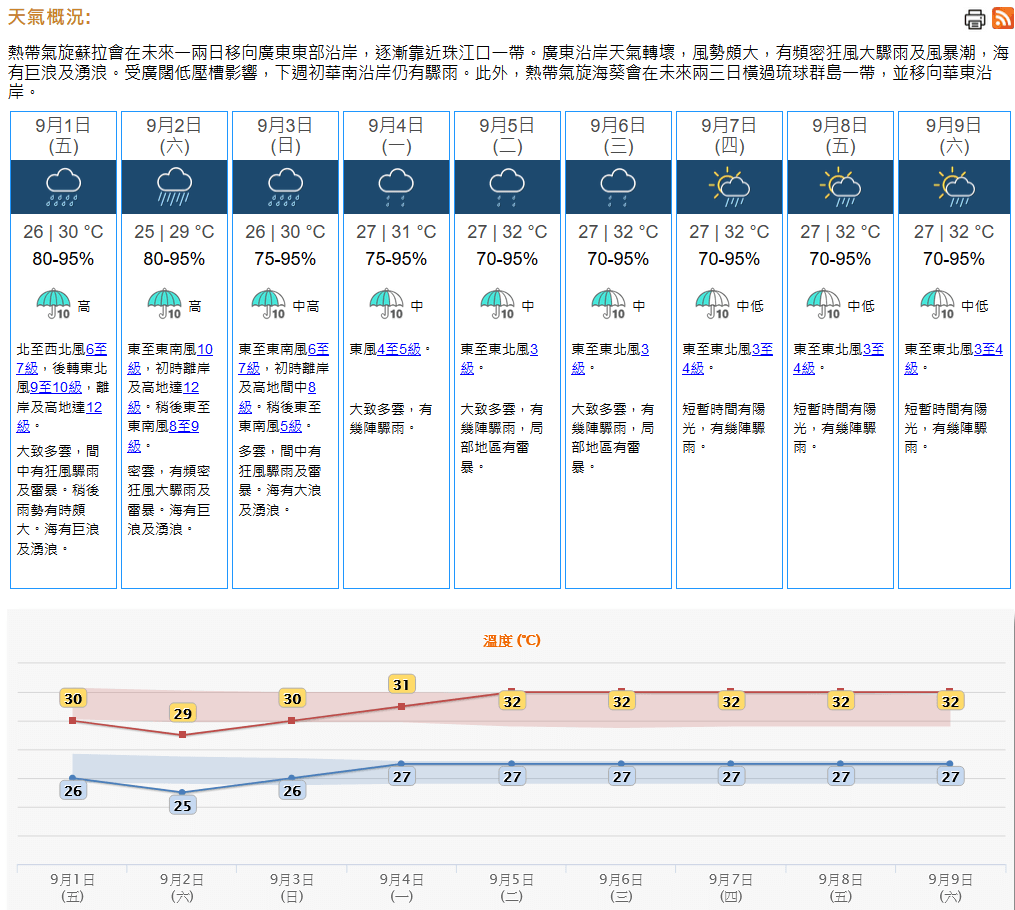
Figure 12 - 9-day weather forecast (in Chinese) issued by the HKO on August 31, indicating the possibility of hurricane force winds (force 12) in Hong Kong on September 1 and 2
圖 12 - 香港天文台於 8 月 31 日發出的九天天氣預報,顯示 9 月 1 及 2 日香港有機會吹颶風 (12 級風)

Figure 13 - HKO's forecast track at 2 am September 1. SAOLA was forecast to be extremely close to the Observatory's headquarters later that night as a severe typhoon.
圖 13 - 9 月 1 日上午 2 時香港天文台之預測路徑圖,預料蘇拉當晚較後時間將極為接近天文台總部,而且仍達強颱風級


Figure 14 - Satellite image of SAOLA at 10 am September 1 (top) and animation as SAOLA approached Hong Kong (bottom)
圖 14 - 蘇拉之衛星雲圖 (上 - 9 月 1 日上午 10 時;下 - 蘇拉接近香港時之雲圖動畫)

Figure 15 - Wind field analysis at 10:27 am September 1, showing that strong force winds were about to affect Hong Kong
圖 15 - 9 月 1 日上午 10 時 27 分之風場掃描圖,顯示香港即將受強風影響
Figure 16 - Forecast track by the JTWC at 8 pm September 1. Hong Kong was well within the area of hurricane force winds at that time.
圖 16 - 9 月 1 日下午 8 時聯合颱風警報中心之預測路徑圖,香港當時已處於颶風圈內

Figure 17 - HKO's forecast track and position at 11 pm September 1, with estimates of various wind radii plotted
圖 17 - 香港天文台於 9 月 1 日下午 11 時之預測路徑及位置圖 (附估計風圈大小)

Figure 18 - SAOLA's estimated wind field at 8 pm September 1
圖 18 - 9 月 1 日下午 8 時之估計風場圖


Figure 19 - Sea level pressure (left) and its 24-hour change (right) in southern China at 8 pm September 1
圖 19 - 9 月 1 日下午 8 時華南海平面氣壓 (左) 及其 24 小時變化 (右) 分佈圖

Figure 20 - Surface weather chart at 8 pm September 1
圖 20 - 9 月 1 日下午 8 時之地面天氣圖


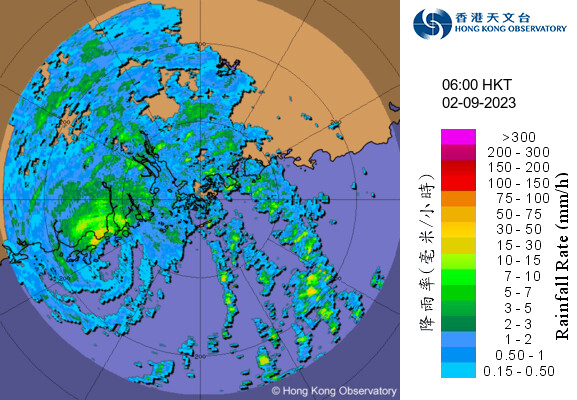
Figure 21 - Radar images (256-km range) at 4-hour intervals from 10 am September 1 to 6 am September 2
圖 21 - 9 月 1 日上午 10 時至 2 日上午 6 時每四小時之 256 公里範圍雷達圖

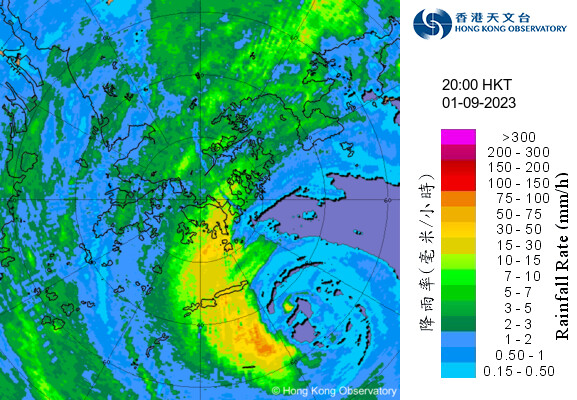
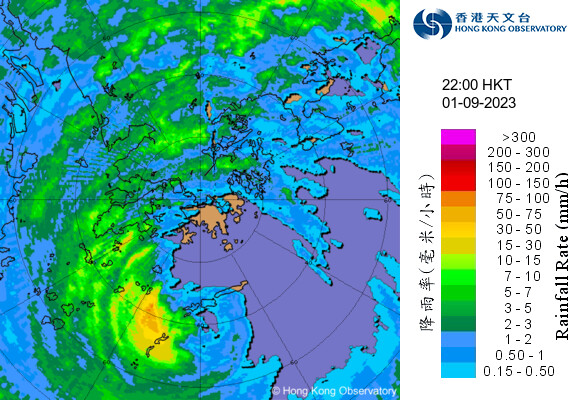
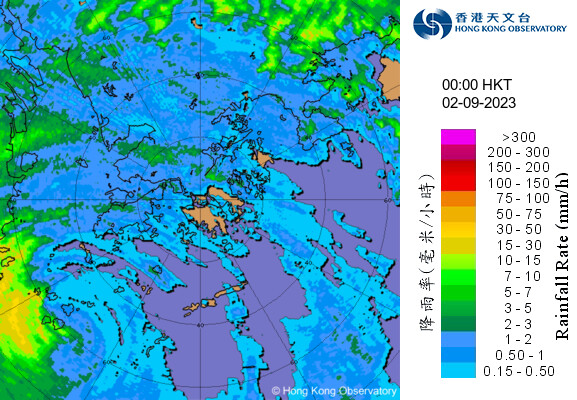
Figure 22 - Radar images (64-km range) at 2-hour intervals from 6 pm September 1 to midnight September 2
圖 22 - 9 月 1 日下午 6 時至 2 日午夜 12 時每兩小時之 64 公里範圍雷達圖

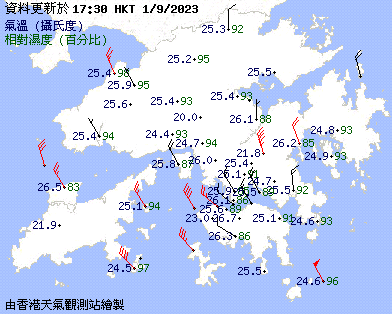
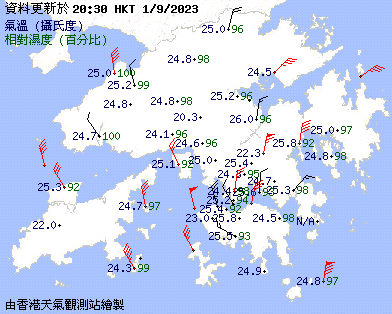
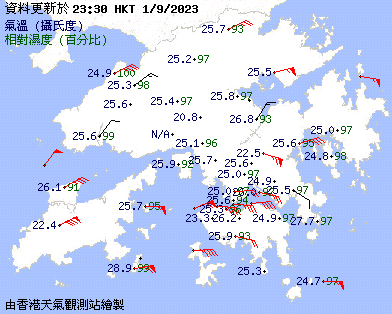

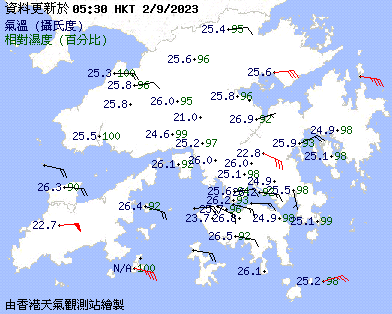


Figure 23 - Local weather element distribution maps at 3-hour intervals from 2:30 pm September 1 to 11:30 am September 2 (strong winds or above are represented by red wind barbs)
圖 23 - 9 月 1 日下午 2 時 30 分至 2 日上午 11 時 30 分每 3 小時之本港天氣元素分布圖 (強風或以上風速以紅色風矢標示)
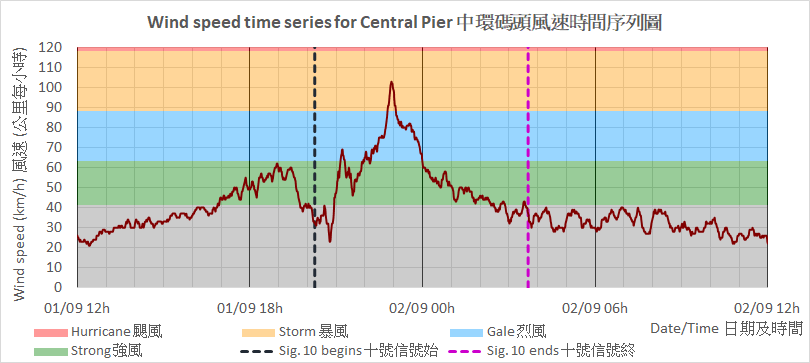


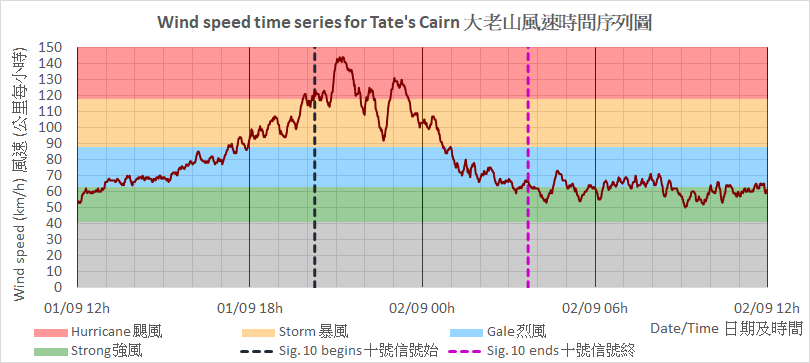
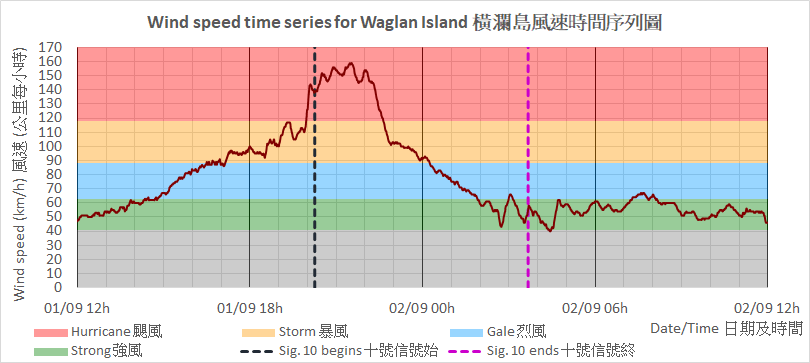
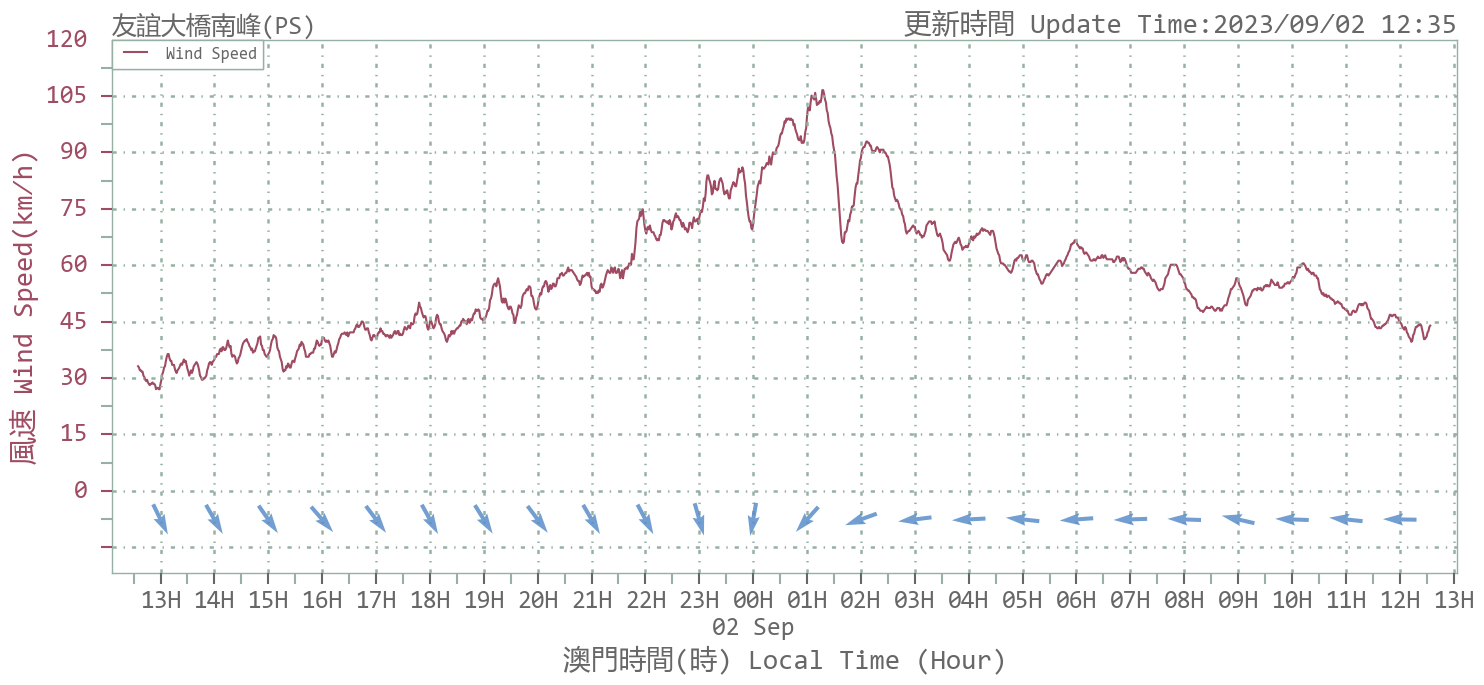
Figure 24 - Wind speed time series at Central Pier, Cheung Chau Beach, Green Island, North Point, Tate's Cairn, Waglan Island and Macau Amizade Bridge South (top to bottom) between September 1 and 2
圖 24 - 中環碼頭、長洲泳灘、青洲、北角、大老山、橫瀾島及澳門友誼大橋南峰 (上至下) 於 9 月 1 至 2 日之風速時間序列圖
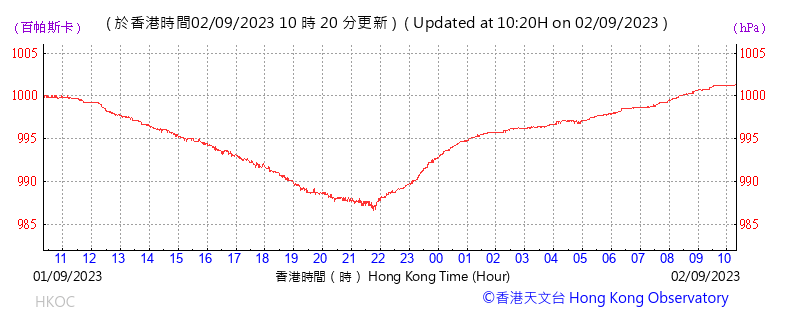

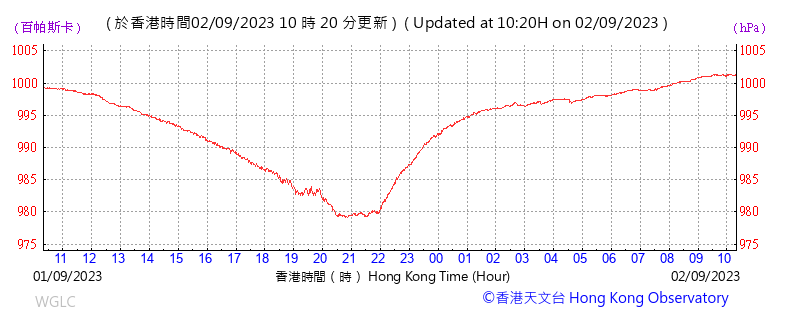

Figure 25 - Mean sea level pressure time series at HKO, Peng Chau, Waglan Island and Taipa Grande in Macau (top to bottom) between September 1 and 2
圖 25 - 香港天文台、坪洲、橫瀾島及澳門大潭山 (上至下) 於 9 月 1 至 2 日之平均海平面氣壓時間序列圖
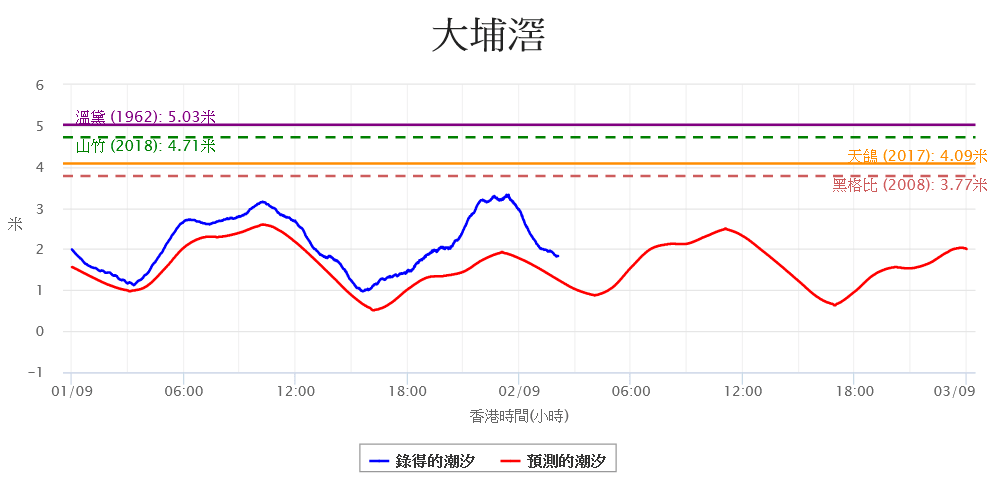
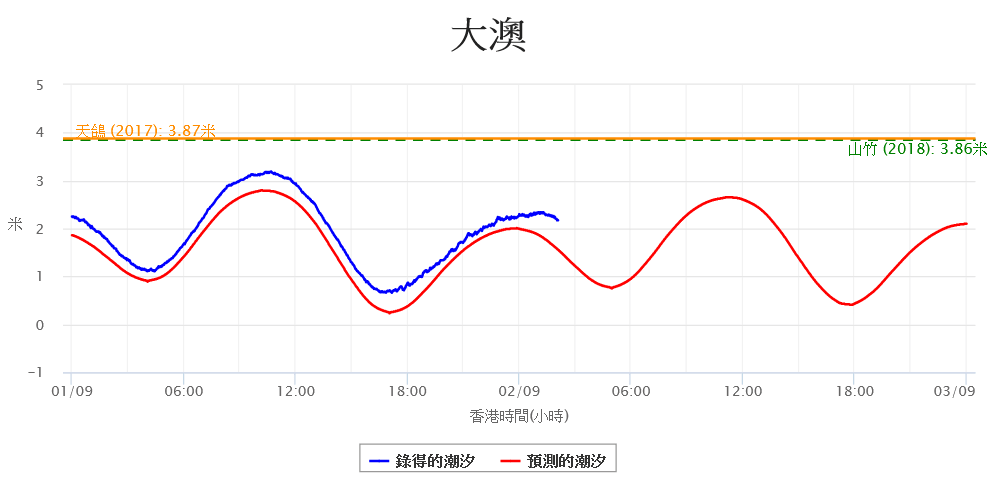
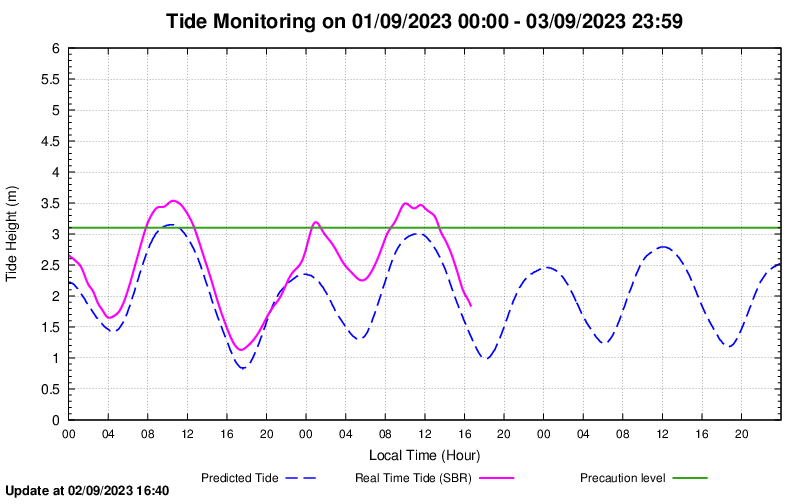
Figure 26 - Observed sea level and predicted tide at Tai Po Kau, Tai O and in Macau (top to bottom) during SAOLA's approach
圖 26 - 蘇拉靠近時大埔滘、大澳及澳門 (上至下) 之實測海水高度及預測潮汐圖

Figure 27 - Real-time image of the Interior Port area of Macau at 10:20 am September 1 (screenshot taken at the SMG website)
圖 27 - 9 月 1 日上午 10 時 20 分澳門內港之實時影像 (澳門地球物理暨氣象局網站截圖)

Figure 28 - Surge in the water level at Tai O during SAOLA's approach in the morning of September 1 (HK Incident Facebook group)
圖 28 - 9 月 1 日上午蘇拉靠近時大澳水位上漲 (香港突發事故報料區 Facebook 群組)
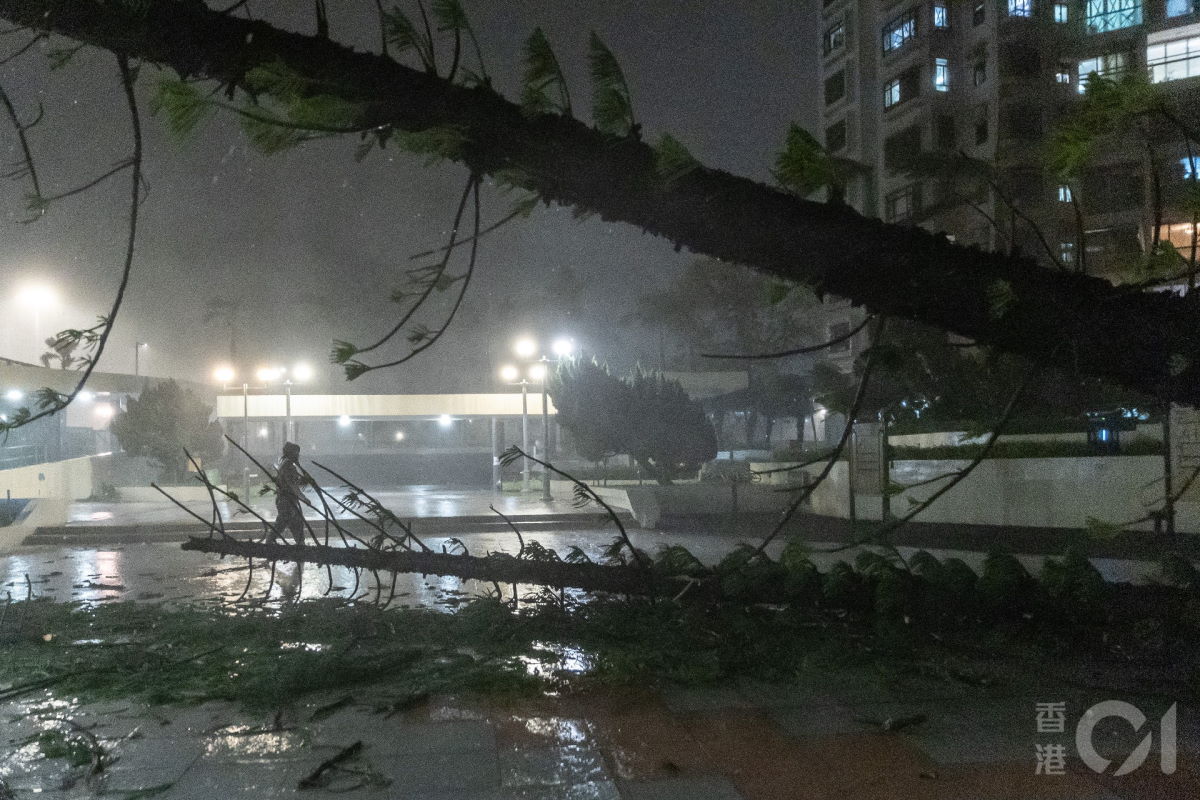
Figure 29 - Fallen trees at Heng Fa Chuen during SAOLA's approach in the night of September 1 (HK01 news article [in Chinese only])
圖 29 - 9 月 1 日晚蘇拉吹襲時杏花邨有大樹倒塌 (香港 01 新聞文章)

Figure 30 - Solar panels scattered around the ground in Lei Cheng Uk Estate (HK Incident Facebook group)
圖 30 - 李鄭屋邨有大量太陽能板散落一地 (香港突發事故報料區 Facebook 群組)
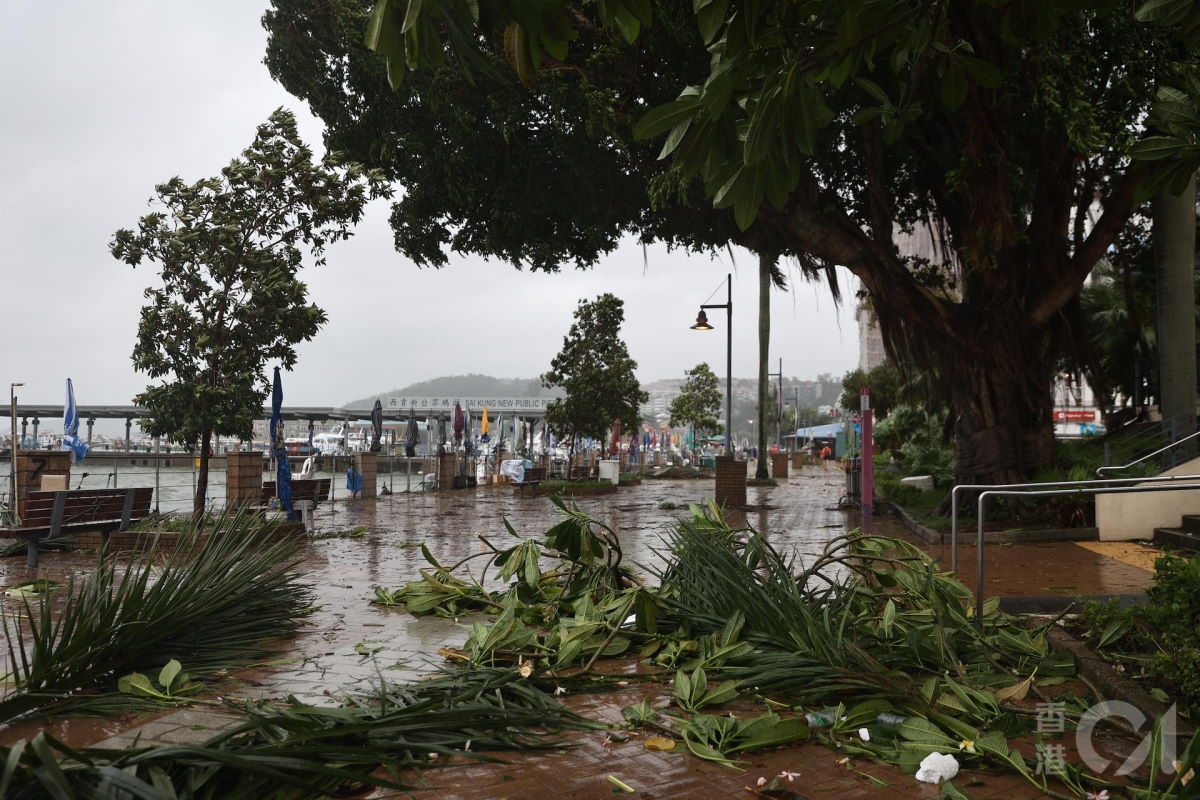
Figure 31 - Aftermath at Sai Kung after SAOLA's approach (HK01 news article [in Chinese only])
圖 31 - 蘇拉吹襲後西貢的情況 (香港 01 新聞文章)


Figure 32 - Rainfall distribution map for September 1 (left) and 2 (right)
圖 32 - 9 月 1 日 (左) 及 2 日 (右) 之雨量分佈圖
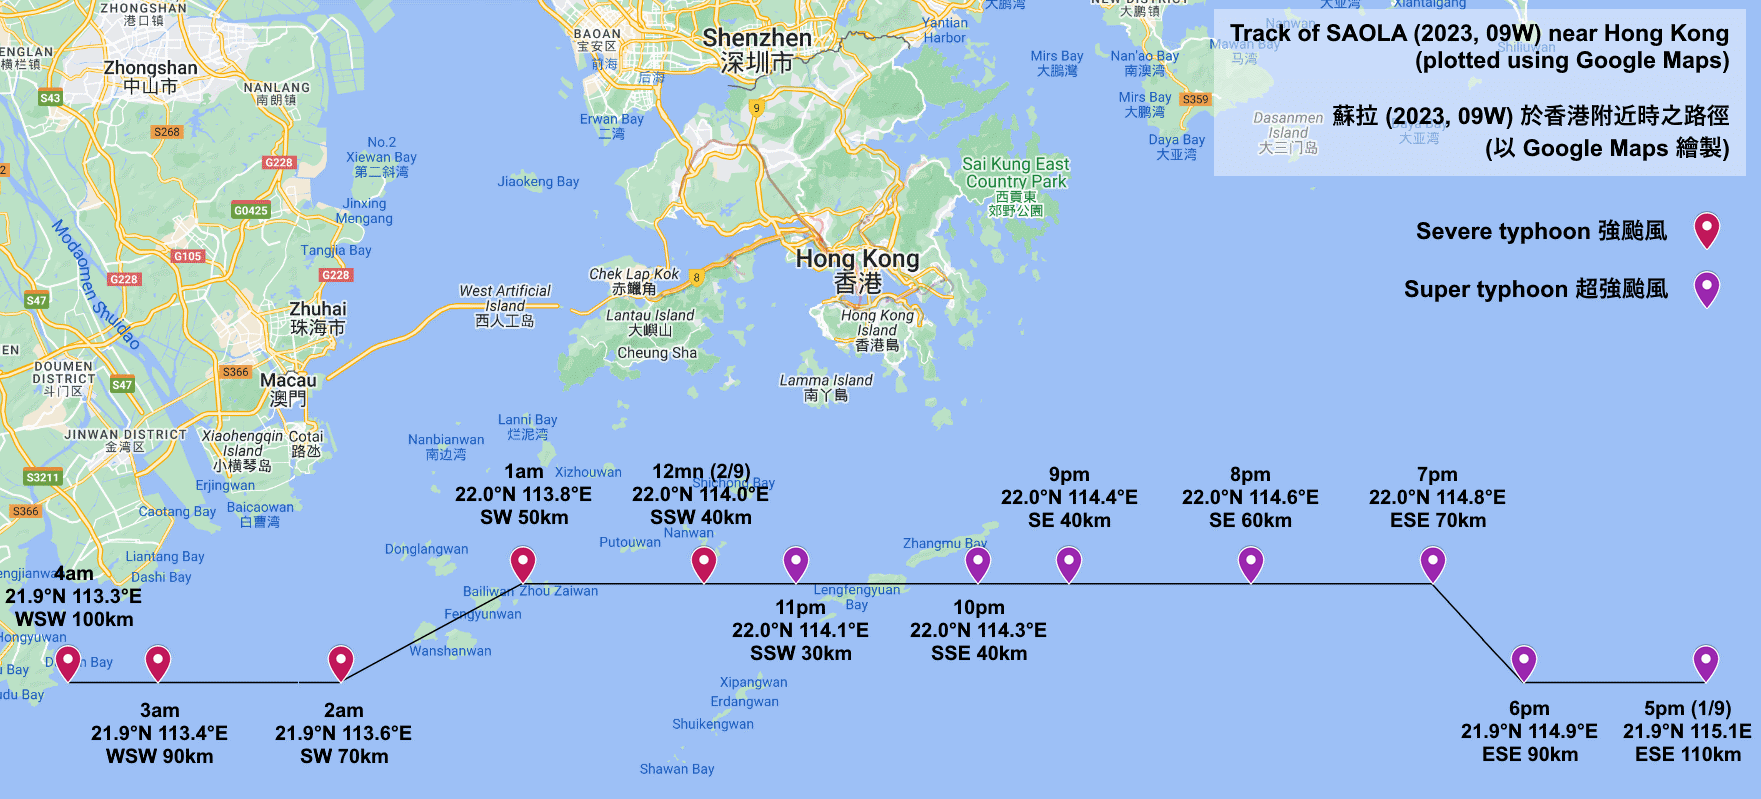
Figure 33 - SAOLA's track near Hong Kong as reported in HKO's hourly tropical cyclone bulletins
圖 33 - 蘇拉於香港附近時之路徑,資料來自天文台的每小時熱帶氣旋警報

Figure 34 - Table of maximum 60-minute average wind speeds during the passage of typhoons necessitating the #10 Hurricane Signal in Hong Kong (Note: data for SAOLA are preliminary)
圖 34 - 引致香港天文台發出十號颶風信號的颱風襲港時最高 60 分鐘平均風速列表 (註:蘇拉的風速為初步數據)
| Winds Recorded at Reference Stations 參考站所錄得的風速 |
The following table lists the maximum 10-minute average (sustained) wind speed recorded while tropical cyclone signals were in force. In some occasions, it is possible that the strongest winds were not recorded when the highest signal was in force.
下表列出各站於熱帶氣旋警告信號生效時所錄得的最高 10 分鐘平均 (持續) 風速,留意此風速不一定於最高信號生效期間錄得。
| Station 風速站 |
Max. 10-min avg. wind speed 最高十分鐘平均風速 |
Beaufort classification 蒲福氏風級分類 |
| Chek Lap Kok 赤鱲角 | 75 km/h | GALE 烈風 |
| Cheung Chau 長洲 | 126 km/h | HURRICANE 颶風 |
| Kai Tak 啟德 | 57 km/h | STRONG 強風 |
| Lau Fau Shan 流浮山 | 81 km/h | GALE 烈風 |
| Sai Kung 西貢 | 94 km/h | STORM 暴風 |
| Sha Tin 沙田 | 48 km/h | STRONG 強風 |
| Ta Kwu Ling 打鼓嶺 | 50 km/h | STRONG 強風 |
| Tsing Yi (SHL) 青衣蜆殼油庫 | 53 km/h* | STRONG 強風 |
* Tsing Yi - Incomplete data
* 青衣 - 數據不完整
| Number of stations recording at least STRONG force (force 6 - 7) winds: 錄得 強風 (6 - 7 級) 或更高風速的站數: |
8 |
| Number of stations recording at least GALE force (force 8 - 9) winds: 錄得 烈風 (8 - 9 級) 或更高風速的站數: |
4 |
| Number of stations recording at least STORM force (force 10 - 11) winds: 錄得 暴風 (10 - 11 級) 或更高風速的站數: |
2 |
| Number of stations recording HURRICANE force (force 12) winds: 錄得 颶風 (12 級) 風速的站數: |
1 |
| Charts and Figures 各項數據 |
Table 1: Track data from HKWW:
表一 : 香港天氣觀測站之路徑資料
YYMMDDZZ Lat Long Wind |
Table 2: Maximum gust and hourly average wind speed recorded in Hong Kong from HKO:
表二 : 香港天文台公佈的各站最高每小時平均風力和陣風數據 (英文)
Maximum Gust |
Maximum Hourly Mean Wind |
|||||||
|---|---|---|---|---|---|---|---|---|
| Direction |
Speed (km/h) |
Date/Month |
Time |
Direction |
Speed (km/h) |
Date/Month |
Time |
|
| Central Pier | E | 140 | 1/9 | 22:49 | E | 79 | 1/9 | 23:00 |
| E | 140 | 1/9 | 22:51 | |||||
| Cheung Chau | NNE | 171 | 1/9 | 22:10 | NNE | 114 | 1/9 | 23:00 |
| Cheung Chau Beach | - | 176 | 1/9 | 22:43 | - | 130 | 1/9 | 23:00 |
| Green Island | NNE | 180 | 1/9 | 21:46 | NNE | 126 | 1/9 | 22:00 |
| Hong Kong International Airport | ENE | 105 | 2/9 | 00:09 | ENE | 69 | 2/9 | 01:00 |
| Kai Tak | NE | 117 | 1/9 | 21:33 | ESE | 47 | 2/9 | 00:00 |
| King's Park | NNE | 121 | 1/9 | 21:16 | NNE | 51 | 1/9 | 22:00 |
| Lamma Island | N | 138 | 1/9 | 20:59 | NW | 80 | 1/9 | 20:00 |
| Lau Fau Shan | NNE | 122 | 1/9 | 22:01 | N | 76 | 1/9 | 21:00 |
| Ngong Ping | ENE | 189 | 2/9 | 00:06 | ENE | 133 | 2/9 | 00:00 |
| North Point | ENE | 140 | 1/9 | 22:56 | ENE | 90 | 1/9 | 23:00 |
| Peng Chau | NE | 147 | 1/9 | 21:53 | E | 108 | 2/9 | 00:00 |
| Ping Chau | ENE | 86 | 1/9 | 21:41 | ENE | 42 | 1/9 | 22:00 |
| Sai Kung | N | 138 | 1/9 | 20:11 | NE | 80 | 1/9 | 22:00 |
| Sha Chau | N | 136 | 1/9 | 22:08 | N | 94 | 1/9 | 23:00 |
| Sha Lo Wan | ENE | 116 | 1/9 | 23:44 | ENE | 65 | 2/9 | 00:00 |
| Sha Tin | NNE | 97 | 1/9 | 21:22 | NNE | 44 | 1/9 | 22:00 |
| Shek Kong | - | 115 | 1/9 | 23:16 | - | 51 | 1/9 | 23:00 |
| Star Ferry (Kowloon) | E | 111 | 1/9 | 23:45 | E | 65 | 2/9 | 00:00 |
| Ta Kwu Ling | ENE | 107 | 1/9 | 23:39 | ENE | 45 | 2/9 | 00:00 |
| Tai Mei Tuk | ENE | 138 | 1/9 | 21:27 | ENE | 99 | 1/9 | 23:00 |
| E | 138 | 1/9 | 22:47 | |||||
| Tai Mo Shan | ENE | 176 | 1/9 | 21:11 | N | 110 | 1/9 | 20:00 |
| Tap Mun East | E | 138 | 1/9 | 23:00 | E | 102 | 1/9 | 23:00 |
| Tate's Cairn | ENE | 183 | 1/9 | 21:07 | NE | 129 | 1/9 | 22:00 |
| Tseung Kwan O | NE | 122 | 1/9 | 20:52 | NE | 44 | 1/9 | 22:00 |
| Tsing Yi Shell Oil Depot | NW | 114 | 1/9 | 19:26 | NNW | 47 | 1/9 | 20:00 |
| Tuen Mun Government Offices | NNE | 108 | 1/9 | 23:00 | NNE | 28 | 2/9 | 00:00 |
| Waglan Island | NNE | 183 | 1/9 | 20:44 | NE | 153 | 1/9 | 22:00 |
| Wetland Park | ENE | 81 | 1/9 | 23:30 | NE | 30 | 2/9 | 00:00 |
| Wong Chuk Hang | NE | 123 | 1/9 | 21:48 | E | 46 | 2/9 | 00:00 |
| E | 123 | 1/9 | 23:52 | |||||
Table 3: Rainfall (in millimetres) contributed by SAOLA from HKO (figures in brackets are based on incomplete hourly data):
表三 : 香港天文台公佈的各站雨量資料 (英文) (方括號內之數據由不完整之每小時資料擷取)
| 30-Aug |
31-Aug |
01-Sep |
02-Sep |
Total Rainfall (mm) |
||
|---|---|---|---|---|---|---|
| Hong Kong Observatory (HKO) | 0.0 |
0.4 |
98.9 |
80.4 |
179.7 |
|
| Hong Kong International Airport (HKA) | Trace |
Trace |
73.0 |
95.0 |
168.0 |
|
| Cheung Chau (CCH) | 0.0 |
0.0 |
39.5 |
35.0 |
74.5 |
|
| H23 | Aberdeen | 0.0 |
1.0 |
84.0 |
65.5 |
150.5 |
| N05 | Fanling | 0.0 |
2.5 |
78.0 |
24.0 |
104.5 |
| N13 | High Island | 0.0 |
0.0 |
96.0 |
35.0 |
131.0 |
| K04 | Jordan Valley | 0.0 |
1.0 |
114.5 |
75.5 |
191.0 |
| N06 | Kwai Chung | 0.0 |
0.5 |
127.0 |
107.0 |
234.5 |
| H12 | Mid Levels | 0.0 |
1.5 |
92.0 |
110.0 |
203.5 |
| N09 | Sha Tin | 0.0 |
1.5 |
112.5 |
55.5 |
169.5 |
| H19 | Shau Kei Wan | 0.0 |
0.0 |
102.0 |
64.0 |
166.0 |
| SEK | Shek Kong | 0.0 |
3.5 |
148.5 |
87.0 |
239.0 |
| K06 | So Uk Estate | 0.0 |
0.0 |
124.0 |
83.0 |
207.0 |
| R31 | Tai Mei Tuk | 0.0 |
0.5 |
92.0 |
32.5 |
125.0 |
| R21 | Tap Shek Kok | 0.0 |
0.0 |
81.0 |
86.0 |
167.0 |
| N17 | Tung Chung | 0.0 |
2.0 |
65.0 |
120.0 |
187.0 |
| TMR | Tuen Mun Reservoir | 0.0 |
0.0 |
100.2 |
81.7 |
181.9 |
Last Accessed 最近訪問日期: Tue May 14 2024 22:07:33 HKT
Last Modified 最近修訂日期: Sun Feb 11 2024
