
TC Watch / 熱帶氣旋 > Selected TC Review / 重要熱帶氣旋回顧 > 202310W (HAIKUI 海葵) [Refresh 更新]
 202310W (HAIKUI 海葵) - Profile 檔案 202310W (HAIKUI 海葵) - Profile 檔案 |
(First draft issued on September 26, 2023, final version issued on February 11, 2024)
(初稿於 2023 年 9 月 26 日發出,最後版本於 2024 年 2 月 11 日上載)
Brief profile of HAIKUI | 海葵小檔案:
| JTWC number 聯合颱風警報中心 (JTWC) 號碼 | 10W |
| International number 國際編號 | 2311 |
| Period of existence 生存時期^ | 2023/08/28 08 HKT - 2023/09/05 20 HKT |
| Maximum 1-minute wind (JTWC) JTWC 一分鐘平均最高中心風速 | 105 knots 節 (Category 3 Typhoon 三級颱風) |
| Minimum pressure (JTWC) JTWC 最低氣壓 | 947 hPa 百帕 |
| Highest TC signal by HKO 香港天文台發出最高熱帶氣旋警告信號 |
1 (Standby Signal 戒備信號) |
| Closest point of approach by HKO 香港天文台所示之最接近距離 |
NE 250 km (real-time warning and TC report 實時報告及熱帶氣旋報告) |
| Time of closest approach by HKO 香港天文台所示之最接近時間 |
2023/09/05 21 HKT (real-time warning 實時報告) / 20 HKT (TC report 熱帶氣旋報告) |
| Lowest pressure recorded at HKO 香港天文台錄得的最低氣壓 |
1000.7 hPa 百帕 (2023/09/04 15:24 HKT) |
^Refers to the period between the HK Observatory's first and last bulletins for the tropical cyclone (with at least tropical depression intensity). For storms formed/dissipated/transformed into an extratropical cyclone outside the area bounded by 7-36°N and 100-140°E, information from the JTWC will be used instead.
^即香港天文台為該熱帶氣旋 (熱帶低氣壓級或更高) 作出發佈的時期。至於在北緯 7 至 36 度、東經 100 至 140 度外形成/消散/轉化為溫帶氣旋的風暴,本網將參考聯合颱風警報中心的資料。
TC signals in Hong Kong* 香港曾經生效的熱帶氣旋警告*:
| Signal 信號 |
Date and time 日期和時間 |
Distance from HK 與香港的距離 |
Predicted movement 預測移動趨勢 |
Max. 10-min winds 中心最高十分鐘平均風速 |
 |
2023/09/04 (MON) 04:40 HKT | E 610 km | WNW at 10 km/h | 130 km/h (70 knots, T) |
 |
2023/09/05 (TUE) 21:40 HKT | NE 250 km | W at 10 km/h | 45 km/h (25 knots, TD) |
*Based on the information from real-time tropical cyclone warning bulletins.
*根據實時熱帶氣旋警報資料。
IR imagery animation 紅外線雲圖動畫:
TC track from HKWW 本站的熱帶氣旋路徑圖:
TC track(s) from HKO 天文台的熱帶氣旋路徑圖:
| Past HKWW Bulletins 本站發佈 |
Please click here for bulletins on this tropical cyclone. 請按這裡。
| Storm Development Overview 風暴發展概覽 |
Unless otherwise stated, all times below are in Hong Kong Standard Time (UTC+8)
除非特別註明,下文時間均為香港標準時間 (協調世界時加 8 小時)
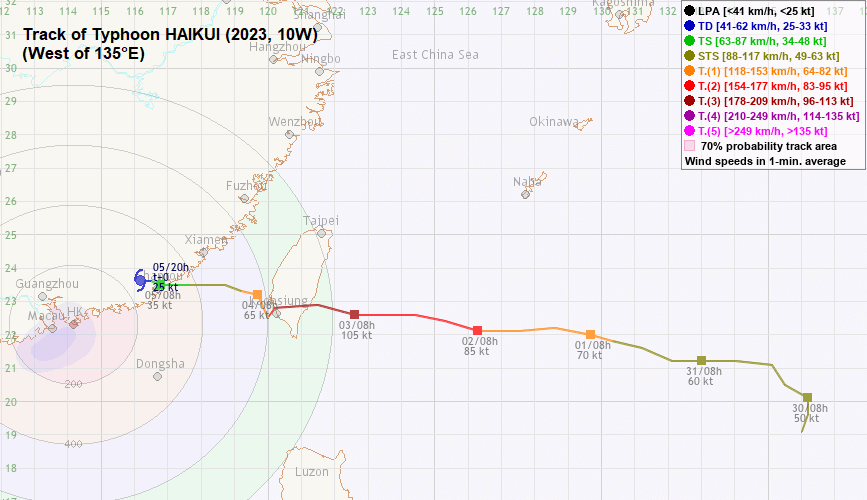
Trropical disturbance 93W developed in the northwest Pacific Ocean some 2,000 km east of tropical cyclone SAOLA in late August. 93W initially drifted northwards near Guam. As its structure improved, the JMA issued a gale warning at 8 am August 27, while the JTWC issued a tropical cyclone formation alert 12 hours later. Sustained convective bursts were seen near its centre on August 28; the JMA upgraded 93W into a tropical storm at 8 am, naming it HAIKUI. This was also the time the HKO upgraded the system into tropical depression status. The JTWC's upgrade came later, at 8 pm that night. It was assigned the storm number 10W.
Numerical models initially projected that HAIKUI would move west-northwest along the southern periphery of the subtropical ridge, and then turn northwest gradually near the Ryukyu Islands. However, the ridge turned out to be stronger than forecast, leading to multiple westward adjustments in the forecast track. HAIKUI intensified gradually on August 29 as it moved west-northwest, and became a severe tropical storm that night. However, the storm suffered from moderate northeasterly vertical wind shear and weakened somewhat the next day. Its core convections became disorganized and the storm centre was partially exposed.
As environmental conditions improved on August 31, HAIKUI started to intensify again and became more compact in size. After a few northward jogs, the storm moved almost due west with some southward dips on September 1. It also intensified into a typhoon at that time. Between August 31 and September 1, official agencies gradually adjusted their forecast tracks, indicating a landfall in southeastern Taiwan rather than northern Taiwan or even Zhejiang province.
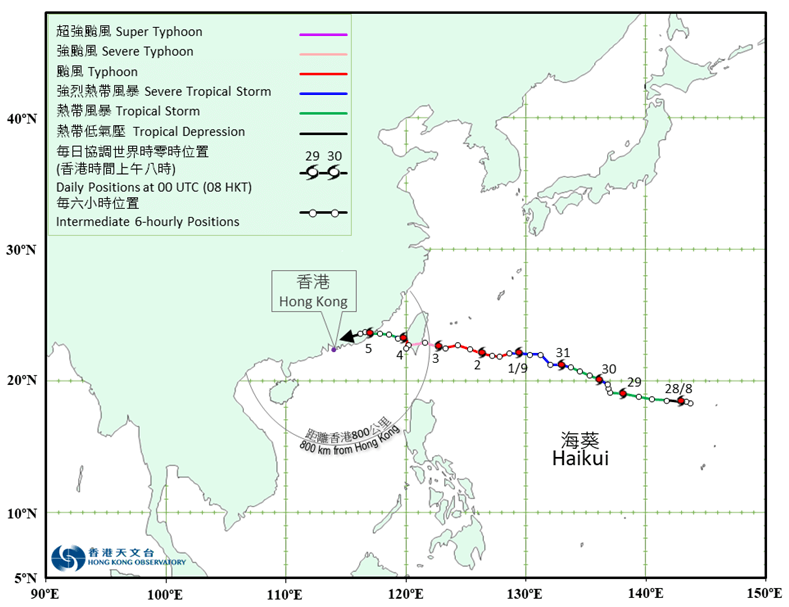
An eye emerged from HAIKUI's central dense overcast on September 3. The storm made landfall in Taitung county near peak strength (105 knots [194 km/h] or equivalent to a category 3 system as assessed by the JTWC; 85 knots [157 km/h] as assessed by the JMA) at about 3:40 pm. It was the first tropical cyclone to make landfall at Taiwan in more than 4 years. Taiwan radar images showed that the storm dipped south but travelled mostly westwards in the next few hours, entering the Taiwan Strait after 8 pm. There it made an anticlockwise loop overnight, and continued to move west on September 4. HAIKUI's structure was severely damaged as it spent much time near or on land. It weakened into a severe tropical storm as it approached eastern Guandong and southern Fujian, eventually making landfall at Dongshan, Fujian at about 5:20 am September 5 as a tropical storm. The NMC reported another landfall at Raoping, Guangdong around 1.5 hours later.
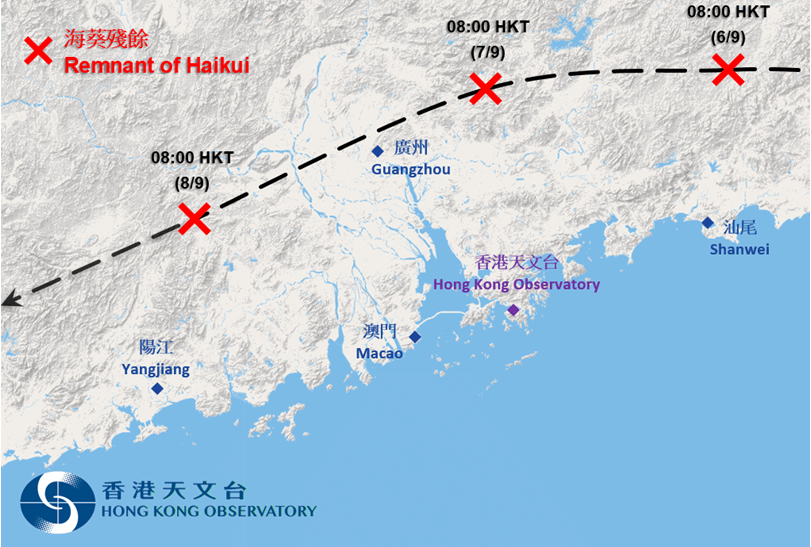
HAIKUI weakened quickly on land and the NMC stopped tracking the system after 2 pm September 6. The storm's remnants continued to travel west to west-southwest on land; the weather in southern China remained unstable towards the end of that week. Record-breaking rainfall was observed in various areas near the Pearl River Delta region, including Hong Kong and Shenzhen.
8 月下旬,熱帶擾動 93W 於氣旋蘇拉以東二千多公里的西北太平洋上發展。93W 初時於關島一帶向北移動,而隨著其結構改善,日本氣象廳於 27 日上午 8 時發出烈風警告,而聯合颱風警報中心則於 12 小時後發出熱帶氣旋形成警報。28 日,93W 近中心持續有對流爆發,日本氣象廳於上午 8 時將其升格為熱帶風暴,並命名為海葵。香港天文台於相同時間將系統升格為熱帶低氣壓,而聯合颱風警報中心則於當晚 8 時作出升格,並給予風暴編號 10W。
數值模式原先預計海葵將沿副熱帶高壓脊南部向西北偏西移動,之後於琉球群島附近逐漸轉向西北。但是該脊較估計強,海葵的路徑預測因而出現多次西調。海葵於 8 月 29 日向西北偏西移動,並於當晚逐漸增強為強烈熱帶風暴。可是,風暴受中等程度東北垂直風切變影響,翌日有所減弱,其核心對流變得散亂,風暴中心部分外露。
隨著大氣環境於 8 月 31 日改善,海葵再次增強,亦變得較為緊密細小。經過數次北跳後,風暴於 9 月 1 日向西移動,間中略為南移,亦增強為颱風。8 月 31 至 9 月 1 日期間,各官方機構逐步調整其預測路徑,由先前預計風暴登陸台灣北部甚至浙江一帶轉為台灣東南部。
9 月 3 日,海葵的風眼於其中心密集雲區中顯現。風暴於接近巔峰強度 (聯合颱風警報中心的估計為 105 節 [每小時 194 公里],即相等於三級颱風強度;日本氣象廳的估計則為 85 節 [每小時 157 公里]) 在下午 3 時 40 分左右登陸台東縣,是四年多以來首個登陸台灣的熱帶氣旋。台灣的雷達圖像顯示海葵登陸後的數小時內稍為南移,但大致向偏西移動,並於下午 8 時後進入台灣海峽。風暴凌晨於該處以逆時針方向打轉,並於 4 日繼續西移。由於海葵登陸及逗留於陸地附近時間較長,它的結構嚴重受損。風暴靠近廣東東部及福建南部時減弱為強烈熱帶風暴,最終於 5 日上午 5 時 20 分左右登陸福建東山,而中央氣象台表示風暴約 1.5 小時後再度登陸廣東饒平。
海葵於陸地上快速減弱,中央氣象台於 9 月 6 日下午 2 時後停止對其作出更新。風暴的殘餘繼續於陸上向西至西南偏西移動,華南當周接近周末天氣不穩定,珠江三角洲一帶地區如香港及深圳更錄得破紀錄的雨量。
| Weather in Hong Kong During Approach 風暴影響時香港天氣狀況 |
Link to relevant HKO weather report bulletins:
4/9 ●
5/9 ●
7/9 ●
8/9
香港天文台相關天氣報告連結:4/9 ●
5/9 ●
7/9 ●
8/9
At noon September 3, the HKO indicated that HAIKUI had come to within 800 km of the territory, and that the #1 Standby Signal would be issued the next day. Due to HAIKUI's subsidence, it was mainly sunny and very hot in Hong Kong that day. The #1 Signal was issued at 4:40 am September 4, when HAIKUI was around 610 km east of Hong Kong. There was however no noticeable change in the weather conditions after the #1 Signal was issued - except for some localized showers, the weather remained very hot and winds were mostly light to moderate.
In the 4 am tropical cyclone bulletin on September 5, the HKO suggested that the chance of issuing the #3 Signal was low unless HAIKUI took a significantly more southward track. As HAIKUI weakened further inland into an area of low pressure, the HKO cancelled the #1 Standby Signal at 9:40 pm.
On September 7, a low pressure trough associated with HAIKUI's remnants enhanced the southwesterly airstream. The extremely moist air mass produced torrential rain in Hong Kong and nearby areas throughout that night and in the morning of September 8. Heavy rain started to fall after sunset on September 7 in northern New Territories, with more than 70 mm of rain in an hour near Sha Tau Kok. The Special Announcement on Flooding in the Northern New Territories was issued at 7:50 pm. The rain became more widespread in the next few hours; the Amber Rainstorm Warning was issued at 9:25 pm, which was upgraded to the Red and Black warnings at 9:50 pm and 11:05 pm, respectively. Over 100 mm of rain per hour was recorded in multiple districts for many hours that night; between 11 pm September 7 and midnight September 8, the hourly rainfall reached 130 km in Kowloon City, Wan Chai, Yau Tsim Mong, Eastern, Sham Shui Po, Sha Tin and Wong Tai Sin districts. The HKO headquarters recorded an hourly rainfall of 158.1 mm, exceeding the previous record of 145.5 mm in 2008. The Landslip Warning was issued at 11:45 pm, and the public was advised to keep away from steep slopes or retaining walls.
More rainbands swept across the territory in the small hours of September 8. The government announced the commencement of "extreme conditions" near 5:30 am, and that classes of all day schools would be suspended that day. Employers were urged to follow the work arrangements under the #8 Tropical Cyclone Signal. By that morning, parts of eastern and southern Hong Kong Island, Kowloon and central parts of the New Territories had received over 600 mm of rain over a 24-hour period. The rainfall at certain parts on Hong Kong Island even reached 800 mm.
The rain became less intense later in the morning of September 8, but the Black Rainstorm Warning remained in force. The government held a joint press conference at 2:30 pm, where Mr. Chan Kwok-ki, the Chief Secretary for Administration, announced that "extreme conditions" would last until midnight that night, and that work arrangements would remain equivalent to those under the #8 Signal even if the Black Rainstorm Warning was cancelled. After the press conference, the Black Rainstorm Warning was replaced by the Amber Warning at 3:40 pm; the Special Announcement on Flooding in the Northern New Territories was cancelled at the same time. The Amber Rainstorm Warning was cancelled at 4:45 pm. The Black Rainstorm Warning remained in force for 16 hours 35 minutes, more than doubling the previous record of less than 6 hours in 1999. As the overall road conditions improved, the "extreme conditions" ended at midnight September 9. Because of persistent rainfall in subsequent days, the Landslip Warning was only cancelled on September 11, almost four days after its issuance. The Amber and/or Red Rainstorm Warnings were issued on September 10, 14 and 15.
The HKO received 215.7 mm and 425.0 mm of rainfall on September 7 and 8, respectively. The total of 640.7 mm was almost double the average September rainfall, and amounted to a quarter of the average annual rainfall. There was extensive damage all over Hong Kong as a result of the torrential rain, including but not limited to:
- the flooding of the Wong Tai Sin and Kowloon Tong MTR stations, and the whole level LG of Temple Mall North in Wong Tai Sin;
- the flooding of the carpark at Wan Tsui Shopping Centre in Chai Wan, and elsewhere in Eastern District;
- a major landslide at Yiu Hing Road in Shau Kei Wan, with huge rocks falling down the slope and covering the road;
- the road collapse at Repulse Bay Road sinking a travelling car;
- a major landslide and road collapse at Shek O Road leading to its closure, effectively isolating those who lived in the communities near the Shek O area;
- the landslide at Redhill Peninsula
in Southern District revealed the presence of illegal structures and encroachment on government land in many units of the luxury estate;
- flash floods in various villages in northern New Territories.
Four people were killed during the heavy rains, including one who was believed to have committed suicide. More than 140 people were injured and sought medical assistance at the Accident and Emergency Department of public hospitals. The Drainage Services Department reported 60 flooding cases till noon September 8. It was explained that local drainage facilities were designed to withstand up to a "once-in-200-year" flood, and they were overwhelmed during this "once-in-500-year" flood event. During the heavy rainfall, the Shenzhen Reservoir started to discharge water just after midnight September 8. In the joint press conference, local officials emphasized that relevant departments were informed immediately after receiving the discharge notice for the deployment of personnel to implement precautionary and evacuation procedures, and that the flooding in various places in the New Territories did not seem to be directly related to the discharge.
9 月 3 日正午 12 時,天文台表示海葵已進入本港 800 公里範圍,並將於翌日發出一號戒備信號。受海葵相關的下沉氣流影響,香港當天大致天晴,天氣酷熱。一號信號於 4 日上午 4 時 40 分發出,當時海葵位於香港以東約 610 公里。信號發出後,香港天氣狀況並沒有顯著變化;除局部地區有幾陣驟雨外,當天天氣仍然酷熱,風勢大致為輕微至和緩水平。
天文台於 9 月 5 日上午 4 時的熱帶氣旋警報中表示,除非海葵採取顯著較南路徑,否則改發三號強風信號的機會較低。隨著海葵於內陸進一步減弱為低壓區,天文台於下午 9 時 40 分取消一號戒備信號。
至 9 月 7 日,與海葵的殘餘相關的低壓槽令西南氣流變得活躍。此股非常濕潤的氣團於當晚及 8 日早上為香港及鄰近地區持續帶來豪雨。新界於 7 日日落後開始下大雨,沙頭角一帶錄得一小時 70 毫米雨量。天文台於下午 7 時 50 分發出新界北部水浸特別報告。其後數小時雨勢漸趨廣泛,黃色暴雨警告於下午 9 時 25 分發出,並分別於下午 9 時 50 分及 11 時 05 分提升為紅色及黑色警告。當晚本港多區連續多個小時均錄得雨量達每小時 100 毫米。7 日下午 11 時至 8 日午夜 12 時的一小時之間,九龍城、灣仔、油尖旺、東區、深水埗、沙田及黃大仙區均錄得超過 130 毫米雨量,而天文台總部的雨量為 158.1 毫米,打破 2008 年錄得的 145.5 毫米紀錄。山泥傾瀉警告於下午 11 時 45 分發出,當局提醒市民不要行近斜坡或擋土牆。
多道雨帶於 9 月 8 日凌晨橫過香港,政府於上午約 5 時半宣佈「極端情況」生效,當天所有日校停課,並呼籲僱主應參考八號熱帶氣旋警告生效下的工作安排。而直至當天早上,香港島東及南部部分地區、九龍及新界中部於過去 24 小時已錄得逾 600 毫米雨量,港島部分區域更達 800 毫米。
雨勢於 9 月 8 日上午後段轉弱,但黑色暴雨警告維持。港府於下午 2 時 30 分舉行聯合記者會,會上政務司司長陳國基表示「極端情況」將最少維持至當晚午夜,而即使黑色暴雨警告取消,工作安排亦與八號熱帶氣旋警告生效時相同。記者會後,黑色暴雨警告於下午 3 時 40 分被黃色警告取代,而新界北部水浸特別報告則於此時取消。黃色暴雨警告於下午 4 時 45 分亦告取消。黑色暴雨警告共生效 16 小時 35 分,是先前 1999 年略少於 6 小時紀錄的兩倍以上。隨著整體路面狀況有所改善,「極端情況」如期於 9 月 9 日午夜結束。由於隨後數天持續有雨,山泥傾瀉警告於發出後差不多四天、即 9 月 11 日才取消。黃色及/或紅色暴雨警告信號曾於 9 月 10、14 及 15 日發出。
天文台於 9 月 7 及 8 日分別錄得 215.7 及 425.0 毫米雨量,兩天總和為 640.7 毫米,幾乎是 9 月平均雨量的兩倍,亦是年平均雨量的約四分之一。豪雨為本港多處帶來廣泛破壞,例如:
- 黃大仙及九龍塘港鐵站出現水浸,而黃大仙中心北館 LG 整層遭雨水淹沒;
- 柴灣環翠商場停車場沒頂,東區多處亦有水浸;
- 筲箕灣耀興道大範圍山泥傾瀉,大石滾下斜坡並覆蓋行車道;
- 淺水灣道出現路陷,一架途經車輛跌進洞穴;
- 石澳道一處山泥傾瀉並沖毀行車道,需要暫時封閉,斷絕石澳一帶居民的交通;
- 南區紅山半島發生山泥傾瀉,因而揭發多棟豪宅有僭建物及霸佔官地;
- 新界北部多條村莊出現暴洪。
暴雨共造成四人死亡,包括一名相信是死於自殺的人士。超過 140 人受傷並前往公立醫院急症室接受治療。直至 9 月 8 日正午,渠務署接獲 60 宗水浸報告。該署解釋渠務設施設計只能承受最多 200 年一遇的大雨,而這次雨災屬 500 年一遇級別,遠超設備可應付水平。豪雨影響本港期間,深圳水庫於 8 日午夜後不久開始排洪。政府官員在聯合記者會上指出,當局收到水庫排洪的預警時已即時通知相關部門,調派人手採取戒備或撤離措施,而新界北部出現的水浸情況似乎與排洪沒有直接關係。
| Image Gallery 圖片庫 |

Figure 1 - Satellite image showing HAIKUI in the initial stages of formation (indicated by the red circle)
圖 1 - 海葵形成初時的衛星雲圖 (紅圈示)


Figure 2 - Numerical model forecasts at 8 am August 29 (top) and September 1 (bottom) (source: Typhoon2000)
圖 2 - 8 月 29 日 (上) 及 9 月 1 日 (下) 上午 8 時之數值模式預報 (來源: Typhoon2000)


Figure 3 - Steering flow chart at 8 am August 29 (top) and September 2 (bottom)
圖 3 - 8 月 29 日 (上) 及 9 月 2 日 (下) 上午 8 時之駛流場分佈圖


Figure 4 - Forecast tracks from various official agencies on August 29 (left) and September 4 (right)
圖 4 - 8 月 29 日 (左) 及 9 月 4 日 (右) 各官方氣象台之預測路徑圖

Figure 5 - Satellite image of HAIKUI at 9 am September 3
圖 5 - 9 月 3 日上午 9 時海葵之衛星雲圖

Figure 6 - Radar image of HAIKUI at 8 am September 3
圖 6 - 9 月 3 日上午 8 時海葵之雷達圖

Figure 7 - Wind field analysis at 9:16 pm September 2
圖 7 - 9 月 2 日下午 9 時 16 分之風場掃描圖

Figure 8 - HKO's forecast track at 8 am September 4
圖 8 - 9 月 4 日上午 8 時香港天文台之預測路徑圖

Figure 9 - Satellite image at 8 am September 8 showing intense convections developing near the Pearl River Estuary
圖 9 - 9 月 8 日上午 8 時之衛星雲圖顯示猛烈對流正於珠江口一帶發展

Figure 10 - Rainfall recorded in various parts of Hong Kong between 11 pm September 7 and midnight September 8 (in Chinese)
圖 10 - 9 月 7 日下午 11 時至 8 日午夜 12 時本港各區雨量


Figure 11 - Rainfall distribution map for the hour preceding midnight September 8 (left) and for the 24-hour preceding 4:30 pm September 8 (right)
圖 11 - 9 月 8 日午夜 12 時之過去一小時雨量 (左) 及 9 月 8 日下午 4 時 30 分之過去 24 小時雨量 (右)
Figure 12 - Radar animation between 5 pm September 7 and 3 pm September 8
圖 12 - 9 月 7 日下午 5 時至 8 日下午 3 時之雷達動畫

Figure 13 - Image of a woman being swept away by the rushing water at Wan Tsui Road in Chai Wan (screenshot from online video)
圖 13 - 一名女士於柴灣環翠道被洪水沖走 (網上片段截圖)


Figure 14 - Rainwater rushing into Wong Tai Sin MTR station (left) and the ensuing floods at the platform (screenshots from online videos)
圖 14 - 雨水沖入黃大仙港鐵站 (左) 導致月台出現水浸 (右) (網上片段截圖)

Figure 15 - Major landslide at the slopes near Yiu Tung Estate in Shau Kei Wan (online image)
圖 15 - 筲箕灣耀東邨附近山坡發生大型山泥傾瀉 (網上圖片)

Figure 16 - The whole LG floor of Temple Mall North was flooded during the heavy rain (Sing Tao Daily news article [in Chinese])
圖 16 - 黃大仙中心北館 LG 層整層在大雨中被淹沒 (星島日報新聞文章)

Figure 17 - Serious flooding at the Wong Tai Sin MTR station exit next to the Temple Mall (online image)
圖 17 - 鄰近黃大仙中心北館之港鐵站出口出現嚴重水浸 (網上圖片)


Figure 18 - Road collapse at Shek O Road on September 8 (top) and 14 (bottom) (source: Sing Tao Daily news article [in Chinese]; Facebook post by Jonathan Leung, Southern District Councillor)
圖 18 - 9 月 8 日 (左) 及 14 日 (右) 石澳道坍塌情況 (來源:星島日報新聞文章;南區區議員梁進 Facebook 貼文)

Figure 19 - Landslide at Redhill Peninsula in Tai Tam, Southern District (online image)
圖 19 - 南區大潭紅山半島發生山泥傾瀉 (網上圖片)
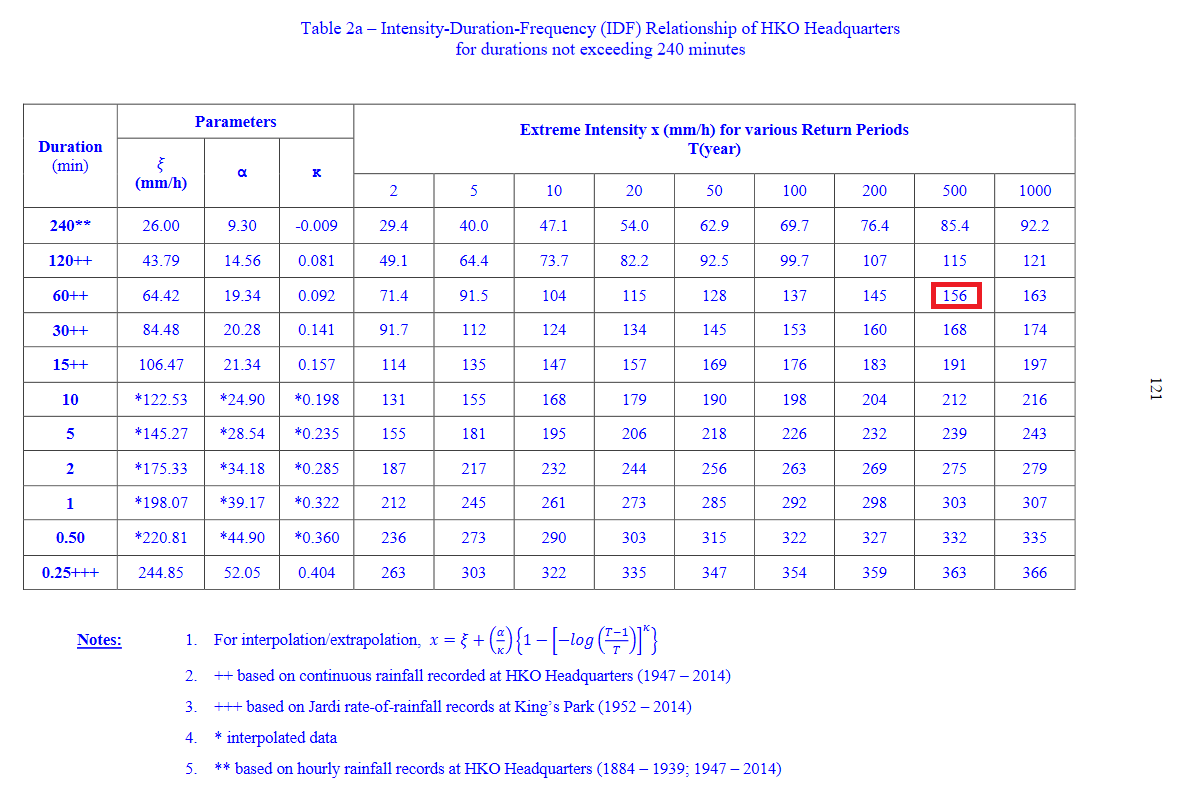
Figure 20 - A manual published by the Drainage Services Department in 2018 (link) shows that the 158.1 mm hourly rainfall recorded at the HKO during the rainstorm reached the 500-year return level
圖 20 - 渠務署於 2018 年出版的一份技術手冊 (連結) 顯示天文台錄得的 158.1 毫米時雨量達「500 年一遇」程度
| Winds Recorded at Reference Stations 參考站所錄得的風速 |
The following table lists the maximum 10-minute average (sustained) wind speed recorded while tropical cyclone signals were in force. In some occasions, it is possible that the strongest winds were not recorded when the highest signal was in force.
下表列出各站於熱帶氣旋警告信號生效時所錄得的最高 10 分鐘平均 (持續) 風速,留意此風速不一定於最高信號生效期間錄得。
| Station 風速站 |
Max. 10-min avg. wind speed 最高十分鐘平均風速 |
Beaufort classification 蒲福氏風級分類 |
| Chek Lap Kok 赤鱲角 | Below "fresh" threshold of 31 km/h 低於「清勁」下限的 31 km/h | |
| Cheung Chau 長洲 | ||
| Kai Tak 啟德 | ||
| Lau Fau Shan 流浮山 | 40 km/h | Fresh 清勁 |
| Sai Kung 西貢 | Below "fresh" threshold of 31 km/h 低於「清勁」下限的 31 km/h | |
| Sha Tin 沙田 | ||
| Ta Kwu Ling 打鼓嶺 | ||
| Tsing Yi (SHL)* 青衣蜆殼油庫* | ||
* Tsing Yi - Incomplete data
* 青衣 - 數據不完整
| Number of stations recording at least STRONG force (force 6 - 7) winds: 錄得 強風 (6 - 7 級) 或更高風速的站數: |
0 |
| Number of stations recording at least GALE force (force 8 - 9) winds: 錄得 烈風 (8 - 9 級) 或更高風速的站數: |
0 |
| Number of stations recording at least STORM force (force 10 - 11) winds: 錄得 暴風 (10 - 11 級) 或更高風速的站數: |
0 |
| Number of stations recording HURRICANE force (force 12) winds: 錄得 颶風 (12 級) 風速的站數: |
0 |
| Charts and Figures 各項數據 |
Table 1: Track data from HKWW (Note: Due to the change in our TC policy in 2023, the track data only become available when a tropical cyclone comes close to or is within the region bounded by 10-30°N and 100-135°E):
表一 : 香港天氣觀測站之路徑資料 (註:因應本站於 2023 年修改熱帶氣旋發佈機制,路徑資料只適用於即將進入北緯 10 至 30 度、東經 100 至 135 度範圍,或已在此範圍內的熱帶氣旋)
YYMMDDZZ Lat Long Wind |
Table 2: Maximum gust and hourly average wind speed recorded in Hong Kong from HKO:
表二 : 香港天文台公佈的各站最高每小時平均風力和陣風數據 (英文)
Maximum Gust |
Maximum Hourly Mean Wind |
|||||||
|---|---|---|---|---|---|---|---|---|
| Direction |
Speed (km/h) |
Date/Month |
Time |
Direction |
Speed (km/h) |
Date/Month |
Time |
|
| Central Pier | ENE | 29 | 4/9 | 22:58 | WNW | 18 | 5/9 | 11:00 |
| Cheung Chau | WNW | 44 | 5/9 | 07:29 | NW | 22 | 5/9 | 10:00 |
| Cheung Chau Beach | - | 36 | 4/9 | 20:45 | - | 14 | 5/9 | 08:00 |
| Green Island | NW | 40 | 4/9 | 07:43 | NW | 28 | 5/9 | 09:00 |
| Hong Kong International Airport | NE | 37 | 4/9 | 20:44 | NNW | 24 | 5/9 | 11:00 |
| Kai Tak | NW | 29 | 5/9 | 17:42 | NW | 12 | 5/9 | 12:00 |
| King's Park | N | 36 | 4/9 | 22:03 | NNE | 14 | 4/9 | 23:00 |
| Lamma Island | NW | 25 | 5/9 | 09:10 | NNW | 15 | 5/9 | 09:00 |
| Lau Fau Shan | NNE | 58 | 4/9 | 20:13 | NNW | 21 | 5/9 | 12:00 |
| NNW | 21 | 5/9 | 15:00 | |||||
| Ngong Ping | NNE | 40 | 5/9 | 09:40 | NNE | 23 | 5/9 | 00:00 |
| North Point | WSW | 26 | 4/9 | 04:44 | WSW | 18 | 4/9 | 05:00 |
| WSW | 26 | 4/9 | 04:45 | |||||
| WSW | 26 | 4/9 | 05:06 | |||||
| WSW | 26 | 4/9 | 05:15 | |||||
| Peng Chau | N | 40 | 4/9 | 20:37 | NW | 24 | 5/9 | 08:00 |
| Ping Chau | WNW | 20 | 5/9 | 11:16 | WNW | 8 | 5/9 | 12:00 |
| Sai Kung | N | 33 | 4/9 | 23:26 | N | 17 | 4/9 | 11:00 |
| Sha Chau | N | 58 | 4/9 | 20:36 | NNW | 29 | 4/9 | 21:00 |
| Sha Lo Wan | ENE | 30 | 4/9 | 20:55 | W | 8 | 4/9 | 21:00 |
| WSW | 8 | 5/9 | 07:00 | |||||
| Sha Tin | NE | 24 | 4/9 | 22:15 | NE | 9 | 4/9 | 12:00 |
| Shek Kong | - | 39 | 4/9 | 19:57 | - | 12 | 5/9 | 13:00 |
| Star Ferry (Kowloon) | WNW | 35 | 5/9 | 10:28 | W | 18 | 4/9 | 16:00 |
| Ta Kwu Ling | N | 28 | 4/9 | 10:03 | NNE | 12 | 4/9 | 11:00 |
| Tai Mei Tuk | NE | 43 | 4/9 | 22:02 | NE | 19 | 4/9 | 22:00 |
| Tai Mo Shan | NNE | 54 | 4/9 | 23:32 | NNE | 42 | 5/9 | 00:00 |
| NNE | 54 | 4/9 | 23:38 | |||||
| Tap Mun East | WNW | 43 | 4/9 | 18:26 | WNW | 17 | 5/9 | 10:00 |
| Tate's Cairn | NNE | 57 | 4/9 | 22:19 | NNE | 44 | 4/9 | 23:00 |
| Tseung Kwan O | ENE | 27 | 4/9 | 08:40 | ENE | 12 | 4/9 | 12:00 |
| Tsing Yi Shell Oil Depot | N | 39 | 4/9 | 20:21 | NW | 10 | 4/9 | 09:00 |
| NW | 10 | 4/9 | 10:00 | |||||
| WNW | 10 | 4/9 | 18:00 | |||||
| Tuen Mun Government Offices | NNE | 34 | 4/9 | 20:29 | WNW | 12 | 4/9 | 16:00 |
| Waglan Island | WNW | 30 | 5/9 | 12:05 | NNW | 22 | 5/9 | 02:00 |
| Wetland Park | NNW | 24 | 4/9 | 20:18 | WSW | 6 | 4/9 | 16:00 |
| Wong Chuk Hang | W | 32 | 4/9 | 22:44 | NNW | 8 | 5/9 | 10:00 |
Table 3: Rainfall (in millimetres) contributed by HAIKUI from HKO (figures in brackets are based on incomplete hourly data):
表三 : 香港天文台公佈的各站雨量資料 (英文) (方括號內之數據由不完整之每小時資料擷取)
| 04-Sep |
05-Sep |
06-Sep |
07-Sep |
08-Sep |
Total Rainfall (mm) |
||
|---|---|---|---|---|---|---|---|
| Hong Kong Observatory (HKO) | Trace |
0.4 |
0.0 |
215.7 |
425.0 |
641.1 |
|
| Hong Kong International Airport (HKA) | 4.8 |
Trace |
Trace |
90.9 |
71.0 |
166.7 |
|
| Cheung Chau (CCH) | 0.0 |
0.0 |
0.5 |
35.0 |
113.0 |
148.5 |
|
| H23 | Aberdeen | 0.0 |
0.0 |
0.0 |
175.0 |
375.0 |
550.0 |
| N05 | Fanling | 0.0 |
0.0 |
0.0 |
224.5 |
373.5 |
598.0 |
| N13 | High Island | 0.5 |
0.0 |
0.5 |
34.5 |
114.0 |
149.5 |
| K04 | Jordan Valley | 0.0 |
1.0 |
0.0 |
197.5 |
348.5 |
547.0 |
| N06 | Kwai Chung | 0.0 |
0.0 |
0.0 |
150.5 |
379.5 |
530.0 |
| H12 | Mid Levels | 0.0 |
0.5 |
0.5 |
148.0 |
311.5 |
460.5 |
| N09 | Sha Tin | 0.0 |
0.5 |
0.5 |
167.5 |
234.5 |
403.0 |
| H19 | Shau Kei Wan | 0.0 |
1.0 |
0.0 |
260.5 |
546.0 |
807.5 |
| SEK | Shek Kong | 7.5 |
0.0 |
0.0 |
72.5 |
291.0 |
371.0 |
| K06 | So Uk Estate | 0.0 |
1.0 |
0.5 |
209.0 |
429.0 |
639.5 |
| R31 | Tai Mei Tuk | 0.0 |
0.0 |
0.5 |
196.0 |
138.0 |
334.5 |
| R21 | Tap Shek Kok | 13.0 |
0.0 |
0.0 |
74.5 |
78.0 |
165.5 |
| N17 | Tung Chung | 8.5 |
0.0 |
0.0 |
79.0 |
72.5 |
160.0 |
| TMR | Tuen Mun Reservoir | 6.0 |
0.0 |
0.0 |
96.1 |
118.5 |
220.6 |
Last Accessed 最近訪問日期: Mon Apr 29 2024 23:31:20 HKT
Last Modified 最近修訂日期: Sun Feb 11 2024
